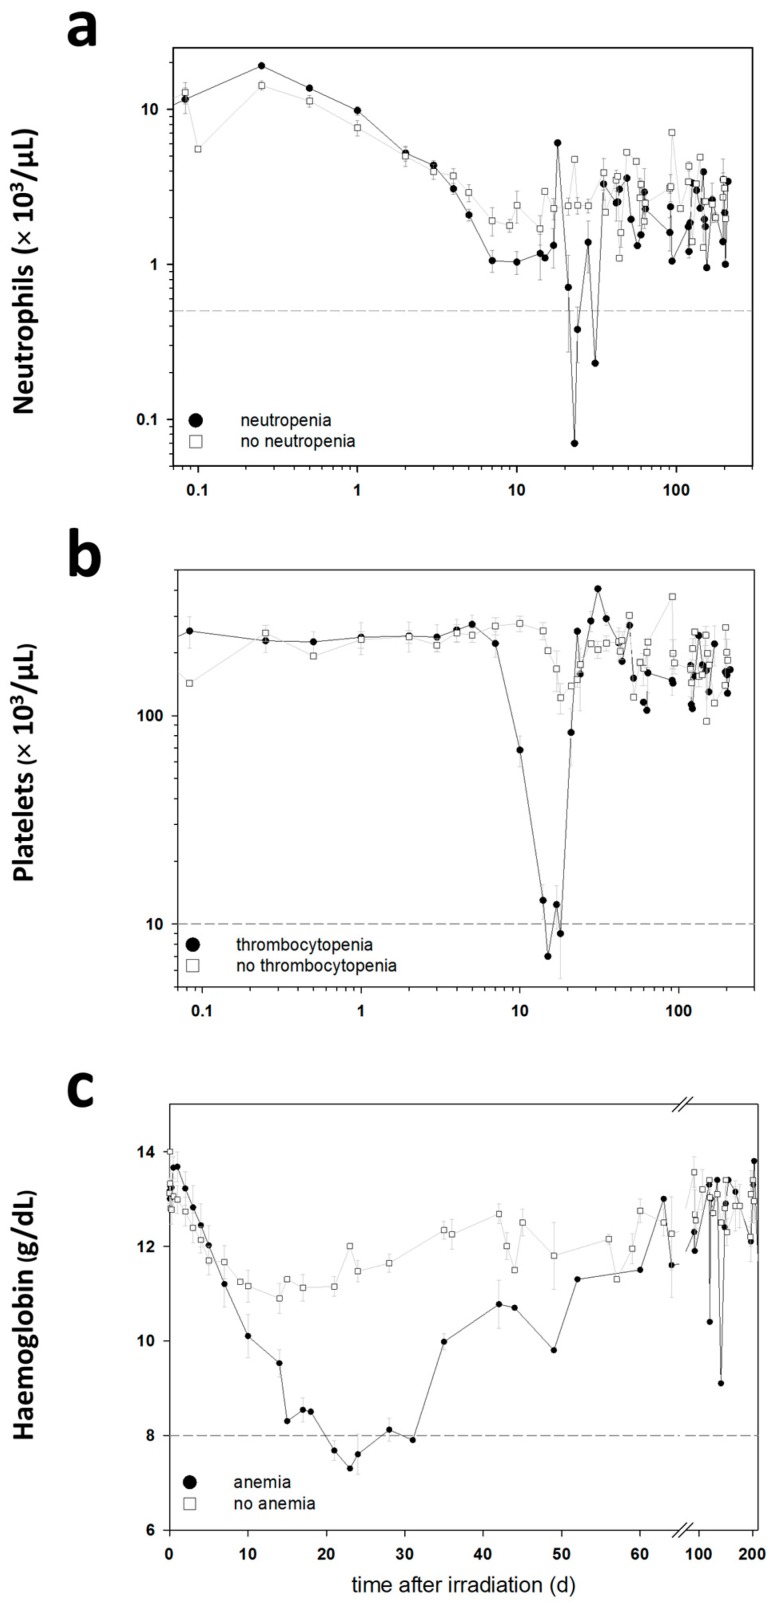
Figure 1.
The mean change (±standard error of mean (SEM)) of neutrophils (a), platelets (b) and haemoglobin (c) in the blood cell counts of the baboons is displayed over the time, up to 203 days after irradiation. Black circles indicate the mean values for the animals with pancytopenia. White squares indicate the mean values of the animals without pancytopenia. The grey dashed lines show the thresholds for the definition of a pancytopenia (neutrophils 0.5 × 1000/µL; platelets, 10 × 1000/µL; haemoglobin, 8 g/dL). Measurements per time point range from n = 1 to n = 16.

