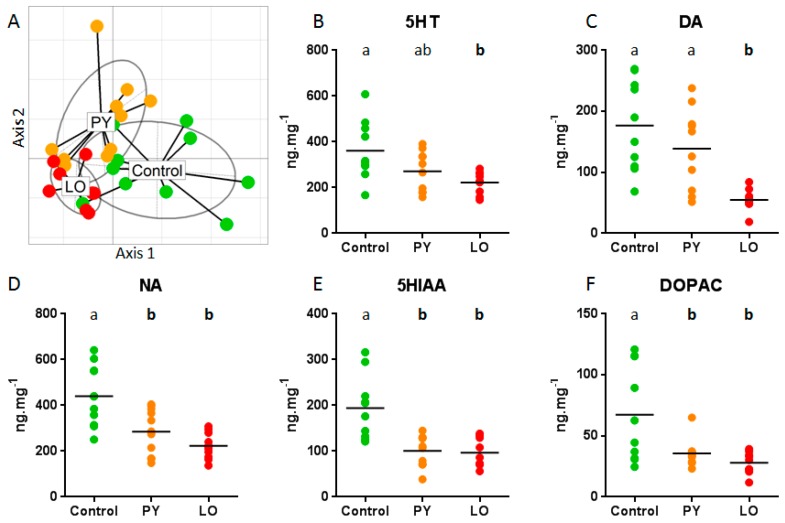
Figure 1.
Analysis of monoamine brain content. (A) principal component analysis (PCA) global analysis of brain monoamine concentrations clearly identify pyrolytic (PY) and light crude oil (LO) as different from Control group. PCA axis 1 contributed to 82.1% of variability and PCA axis 2 for an additional 8.8%; (B–F) Detailed analysis of brain monoamines and metabolites concentrations in PY, LO and Control fish. Each dot represents results from an individual fish. Letters indicate significant differences at p < 0.05 between diets.

