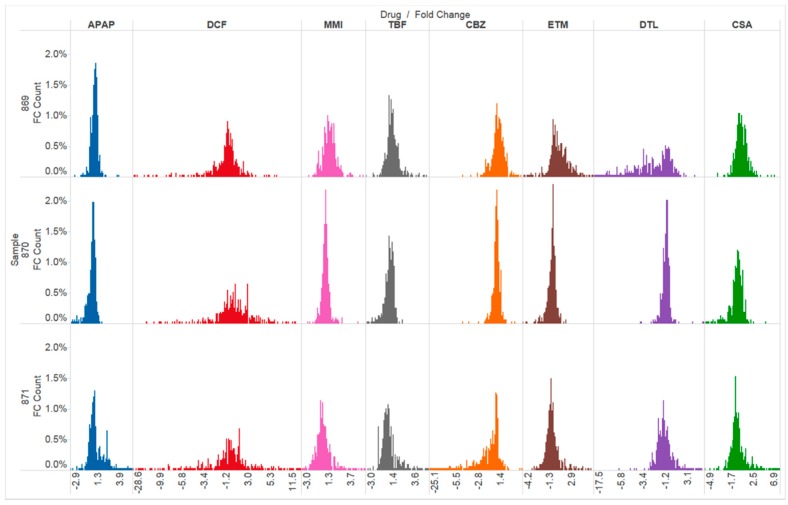
Figure 3.
Histograms of fold change and distribution of the 370 genes queried with the human specific Molecular Toxicology Pathway Finder PCR array. Each column corresponds to a drug and each row corresponds to the individual human livers (869, 870, 871). The global response to the drugs has the same distribution across the drugs, except for DCF and DTL in human liver 869 in which a greater number of genes were altered.

