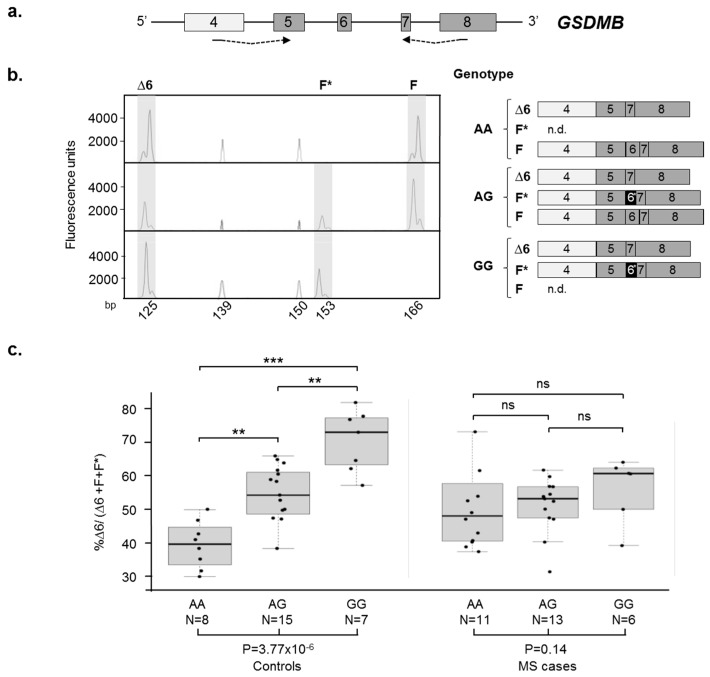
Figure 3.
Analysis of exon 6/6* AS in multiple sclerosis (MS) cases and healthy controls. (a) Schematic representation of the GSDMB genomic region comprised between exons 4 and 8. Exons are approximately drawn to scale; alternative exons are depicted in dark grey, as in Figure 1. The dashed arrows below the scheme indicate the primer couple used in the fluorescent-competitive RT-PCR assay; the forward primer is labelled with the HEX fluorophore; (b) The left panel shows three GeneMapper windows, representing an example of the fluorescent products obtained for each of the rs11078928 genotypes. The peaks shaded in grey correspond to the RT-PCR products; those not shaded represent the size standard (ROX-500 HD). The schematic representation of the obtained products for each genotype is shown on the right. Exon 6* is depicted in black; (c) Boxplots showing the percentage of the Δ6 isoform with respect to the sum of Δ6, F*, and F isoforms measured on RNA extracted from 30 relapsing remitting (RR)-MS cases and 30 controls, grouped on the basis of the rs11078928 genotype. Boxes define the interquartile range; the thick line refers to the median. The number of subjects belonging to each group is also indicated (N). Significance levels of t-tests is shown above the boxplots (** p < 0.01; *** p < 0.001; ns: not significant). The one-way ANOVA p-values are reported below the boxplots.

