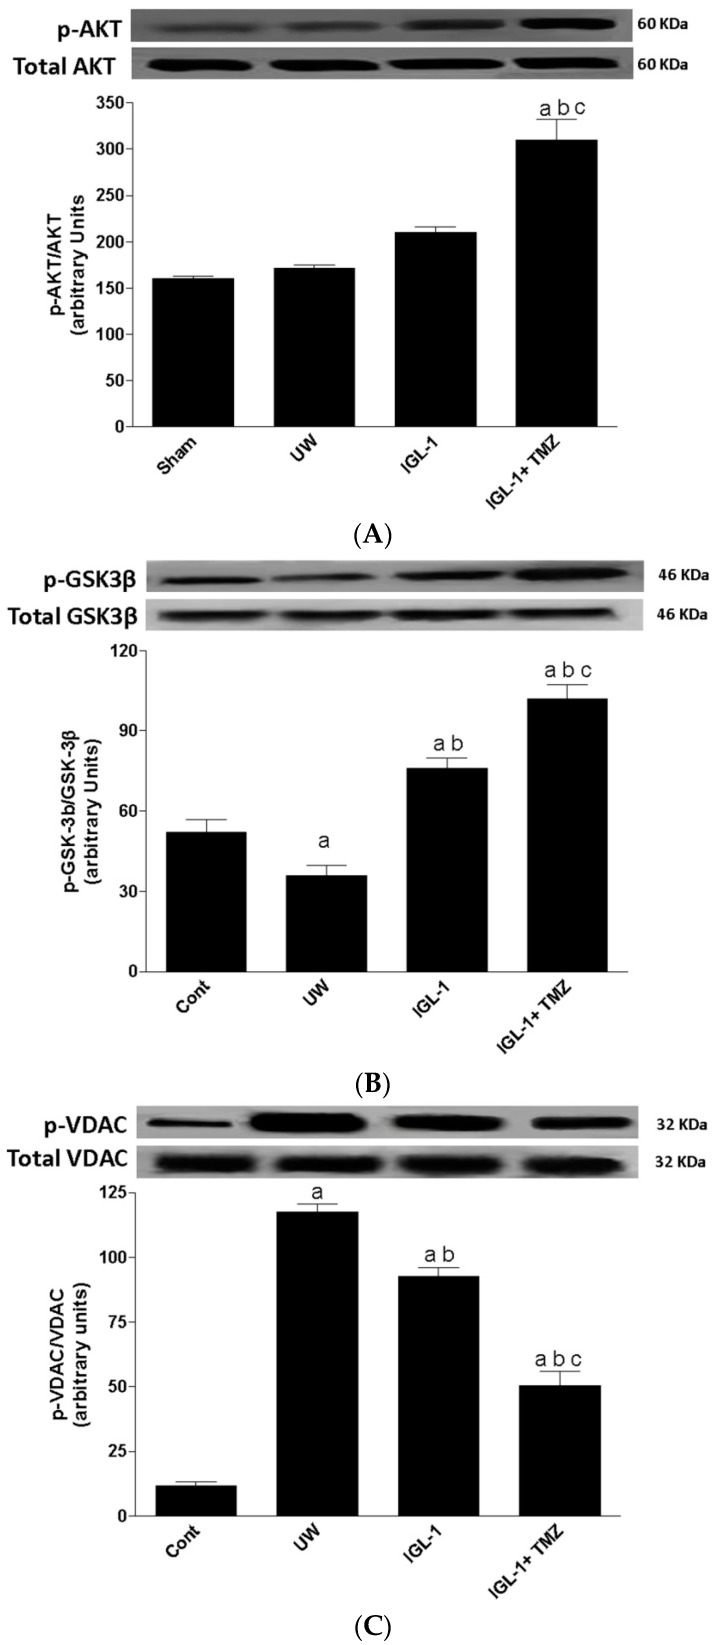
Figure 1.
AKT, GSK3β, and VDAC protein levels after transplantation. Representative Western blot at the top and densitometric analysis at the bottom of total and phospho-AKT (A), total and phospho-GSK3β (B) and phospho-VDAC (C). UW: liver preserved in UW solution; IGL-1: liver preserved in IGL-1 solution; IGL-1+TMZ: liver preserved in IGL-1 solution with trimetazidine. a p < 0.05 vs. Sham, b p < 0.05 vs. UW, and c p < 0.05 vs. IGL-1.

