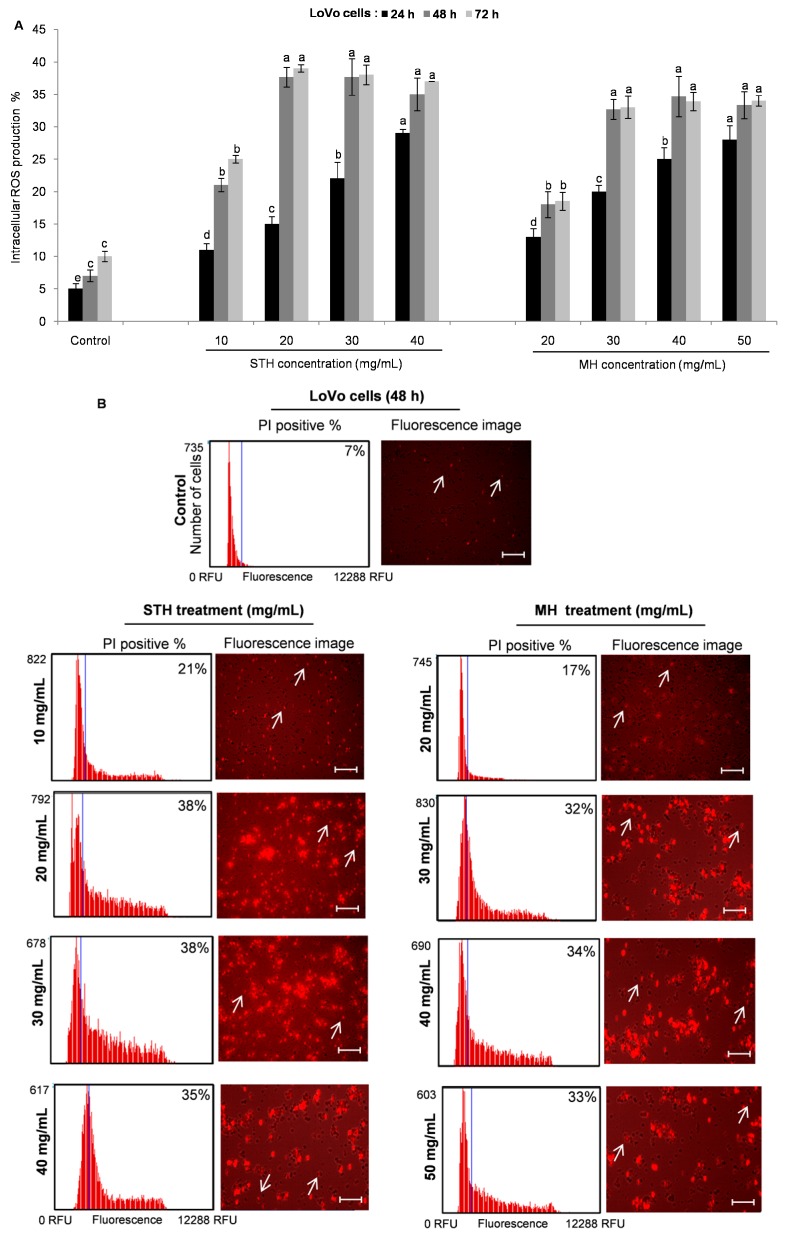
Figure 7.
STH and MH induce ROS generation in LoVo cells. LoVo cells were treated with or without different concentrations of STH (0, 10, 20, 30 and 40 mg/mL) and MH (0, 20, 30, 40 and 50 mg/mL) for 24, 48 and 72 h. Intracellular ROS levels were calculated by using CellROX® Orange assay kit and the Tali™ Image-based Cytometer (A). Image-Based cytometry was used to quantify ROS induction (% of PI positive) in LoVo cells following STH and MH (B) treatment at 48 h. The blue line of the thumbnail histogram indicated the set threshold. Representative fluorescence image of LoVo cells shows the effect of STH and MH treatment: non-fluorescent while in a reduced state and bright red fluorescence upon oxidation by ROS. Scale bar = 50 µm, arrows indicate single cell (cell size = 10 µm). Data are shown as the mean ± SD of three experiments. Columns associated with the same set of data with different symbolic letters are significantly different (p < 0.05) from controls.

