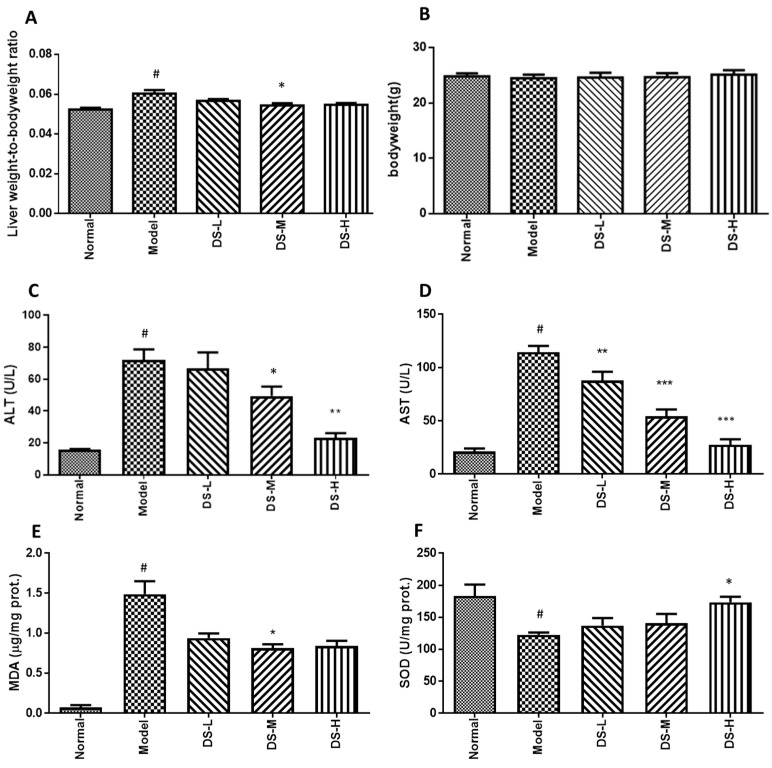
Figure 1.
Liver weight to body weight ratio, body weight measurement, and biochemical assays results after Danshen treatment in acute ALD. (A,B) The liver weight-to-body weight radio and body weight changes; (C) serum ALT level; (D) serum AST level; (E–H) the production of MDA and the activity of SOD, CAT, and GSH-Px in liver tissues. DS-L for low dose of Danshen treatment group (0.093 g/kg); DS-M for middle dose of Danshen treatment group (0.28 g/kg); DS-H for high dose of Danshen treatment group (0.84 g/kg). # p < 0.05, when compared with normal group; * p < 0.05, ** p < 0.01, *** p < 0.001 when compared with model group).


