Figure 4.
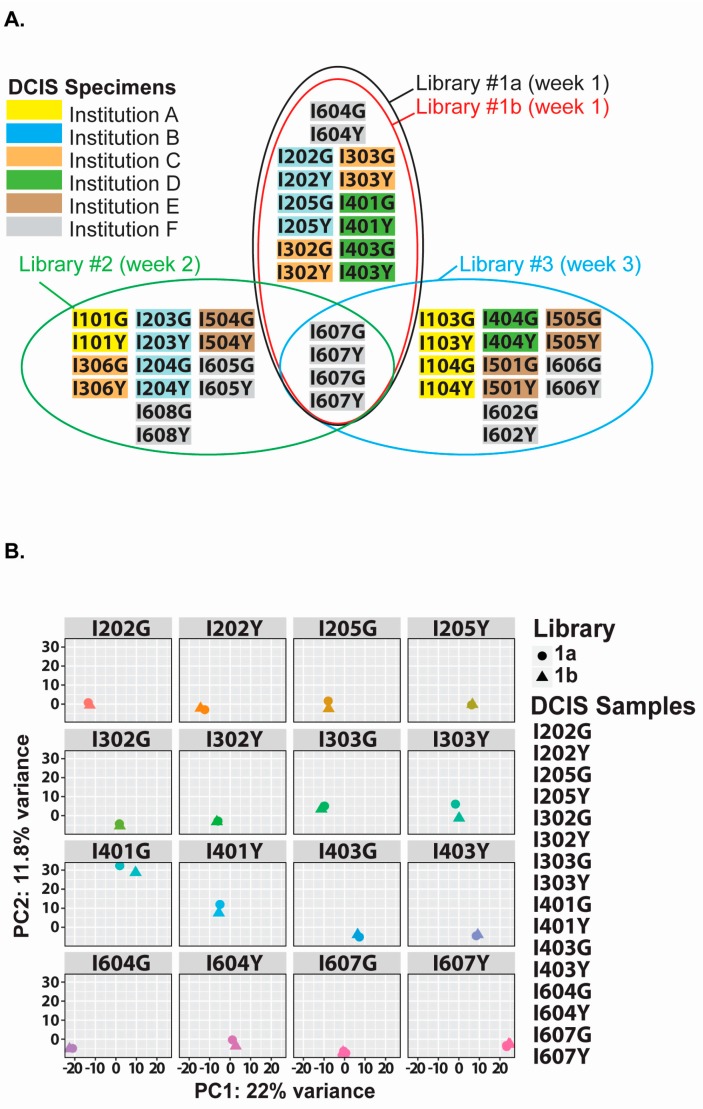
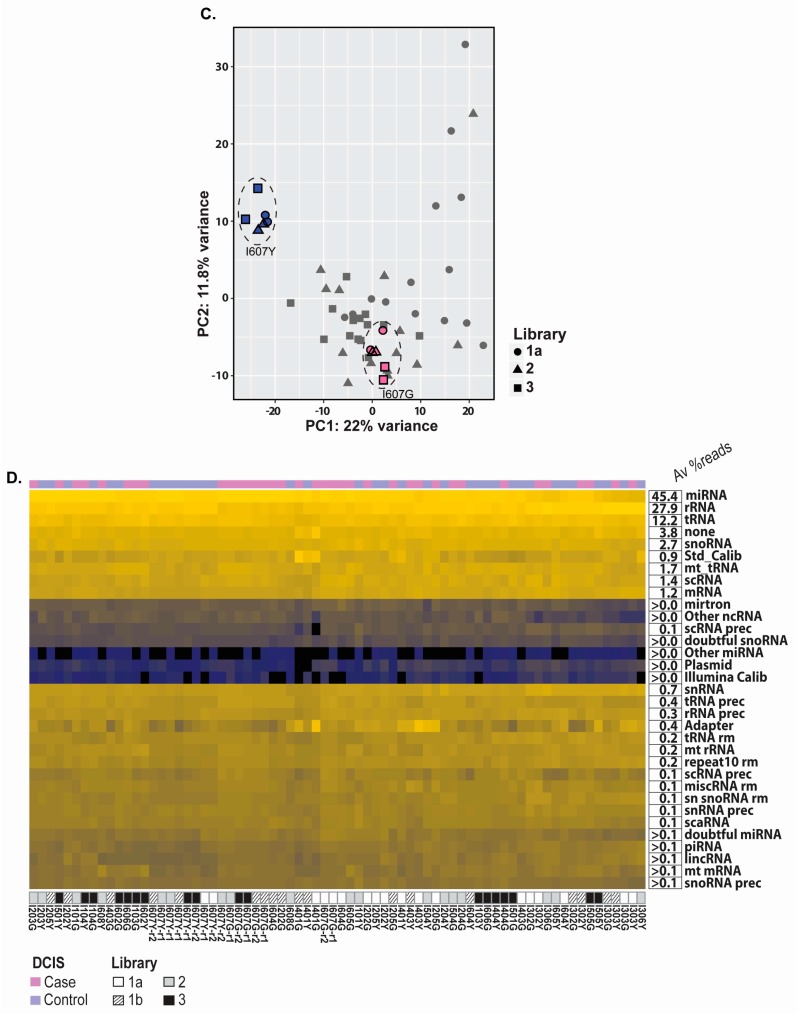
miRNA sequencing of archived DCIS specimens. (A) Matched case-control DCIS specimens are distributed into four libraries (black, red, green, blue ovals). Libraries 1a and 1b are duplicates. All libraries contain a control sample pair, analyzed in duplicate (I607G and I607Y). DCIS samples were obtained from six institutions: A (yellow), Kaiser Permanente Colorado (Denver, CO); B (blue), Henry Ford Health System (Detroit, MI); C (orange), Kaiser Permanente Hawaii (Honolulu, HI); D (green), Mashfield Clinic Research Foundation (Marshfield, WI): E (Brown), Kaiser Permanente Northwest (Portland, OR); F (grey), Montefiore Medical Center, Bronx, NY, New York. Libraries 1 (1a and 1b), 2 and 3 were prepared during three consecutive weeks (Weeks 1, 2 and 3); (B) Principal component analysis (PCA) plot of the variance between miRNA sequencing data from duplicate analyses (16 plots) in Libraries 1a and 1b. On average, each library included 575 miRNAs; (C) PCA plot of the variance between miRNA sequencing data from all libraries (1a (circles), 2 (triangles) and 3 (squares)). All 607Y (blue) and 607G (pink) repeats are circled with a doted line to display tight reproducibility between the different libraries; (D) Heat map representation of unsupervised clustering of small-RNA data obtained from 44 DCIS clinical specimens. The average distribution of all small-RNA molecules sequenced in these specimens is provided on the right. Sample ID, library position and barcoded adapters are provided below the heat map.


