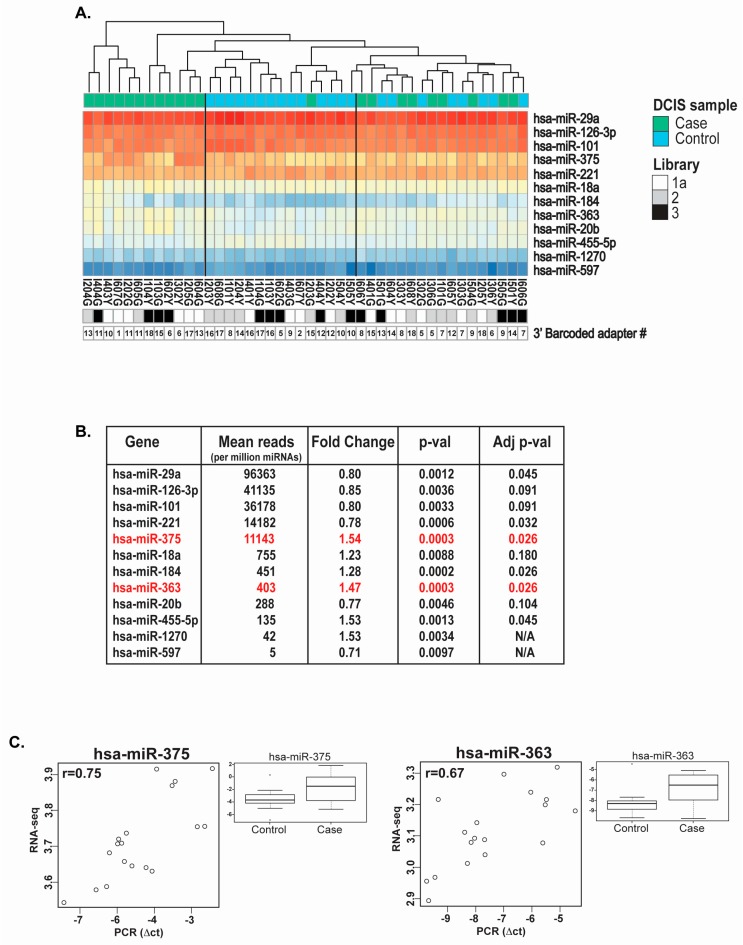
Figure 5.
miRNAs differentially expressed in DCIS lesions based on case-control status. (A) Unsupervised clustering of DCIS cases (n = 22) and controls (n = 22) and heat map representation of the top 12 differentially-expressed miRNAs; (B) Statistical analysis on the top 12 differentially-expressed miRNAs (normalized mean of count reads (base mean), fold change difference (Log2FC), p-value (p-value) and adjusted p-value (Adj pval)). The two miRNAs selected for qPCR validation are highlighted in red; (C) Non-parametric Spearman rank correlation between quantitative PCR data of miR-375 and miR-363 in nine matched case-control DCIS specimens and miRNA sequencing data (the r-value represents the correlation). Two endogenous controls (mean of the comparative threshold measured for small-nucleolar RNAs (RNU44 and RNU6B) were used to normalize miRNA qPCR data. The box plot graphs display the variance stabilizing transformation (vst, DESeq2 package) for the expression of miR-375 and miR-363 in the two groups (cases and controls), with the p-value on differential expression between nine cases and nine controls.

