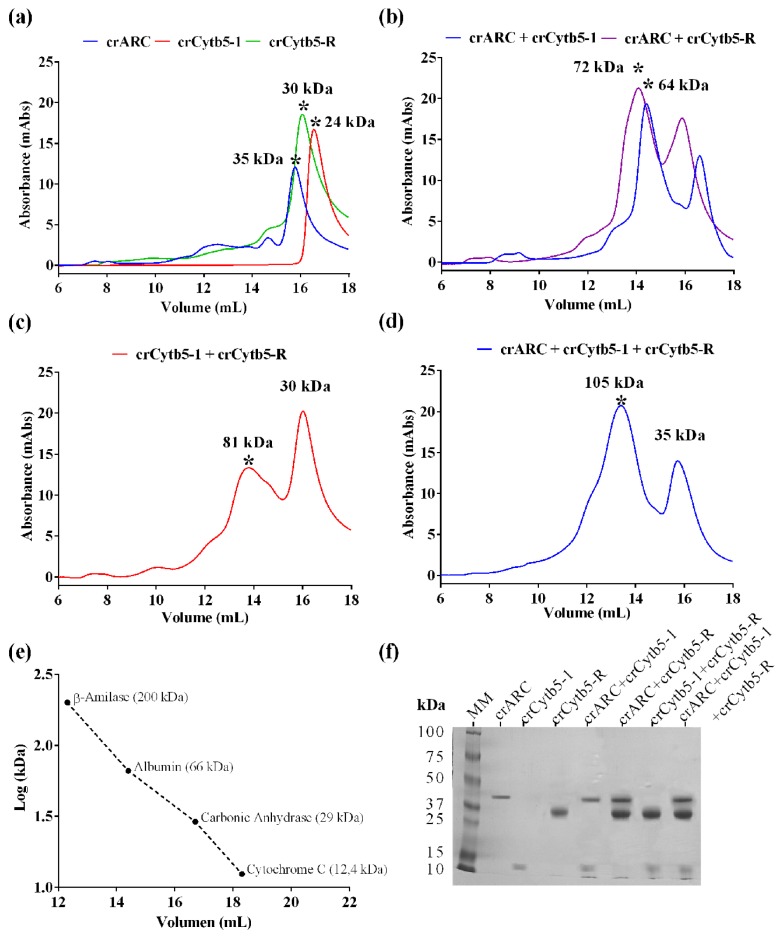
Figure 3.
Interaction studies between crARC, crCytb5-1 and crCytb5-R. The SEC profiles of the indicated samples are shown. In these experiments, the proteins crARC, crCytb5-1 and crCytb5-R were loaded separately and then together in different combinations to observe the appearance of new peaks. (a) The proteins loaded separately; (b) crARC, with crCytb5-1, and crARC with crCytb5-R; (c) The crCytb5-1 protein with crCytb5-R; (d) The proteins crARC plus, crCytb5-1 and crCytb5-R together; (e) Calibration curve obtained using the Mw protein marker; the graph represents the Mw versus the logarithm of the elution volume. The absorbance was measured at 280 nm; (f) sodium dodecyl sulfate (SDS)-polyacrylamide gel electrophoresis of the protein peak indicated with the symbol * obtained in the SEC.

