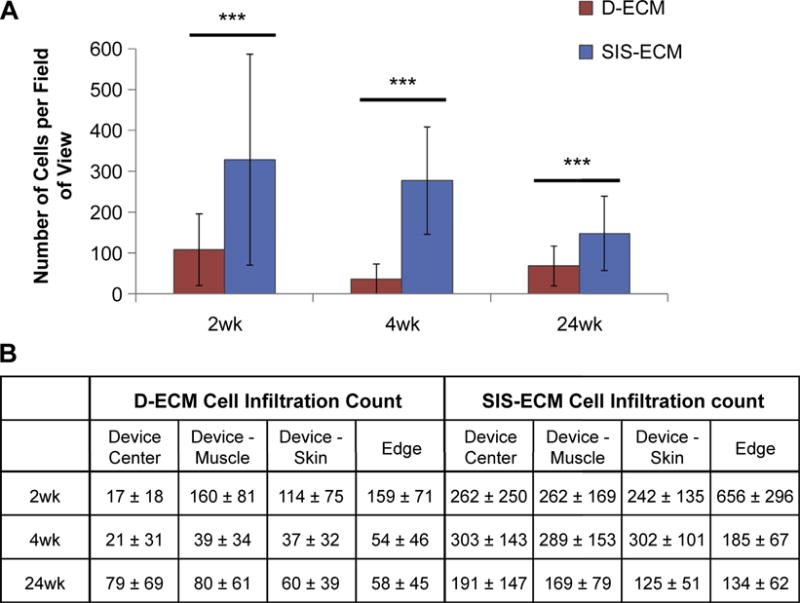
Fig. 6.

The number of cells counted per field of view in SIS-ECM and D-ECM devices after 2, 4, and 24 weeks of implantation. A) Comparing D-ECM to SIS-ECM overall and B) comparing different locations on the device. Results reported as average +/− 1 standard deviation. Using the independent samples Mann–Whitney U test, ***p-value < 0.001.
