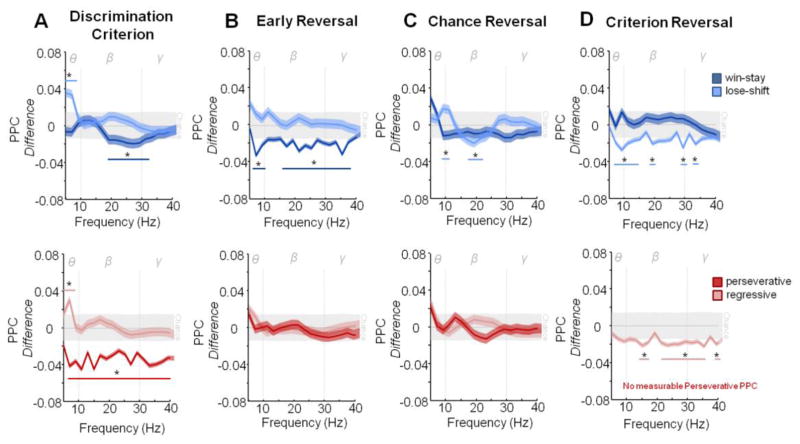
Figure 4. Spike- Oscillatory Synchrony Pattern is Distinct During the Post-Choice Phase of Each Learning Session.
A. Discrimination Criterion. Lose-shift trials showed significant increases in spike-field coupling in the theta frequency while win-stay trials showed significant decoupling in the beta frequency (upper). Regressive error trials had significant increases in the theta range while perseverative responses showed significant decoupling across all frequencies (lower). B. Early Reversal: Lose-shift trials showed no significant coupling or decoupling across frequencies while win-stay trials now showed decoupling across Theta, the majority of Beta and all Gama frequencies (upper). Neither error trial type showed significant coupling or decoupling during this stage (lower). C. Chance Reversal: Win-stay trials showed no significant coupling or decoupling while lose-shift now had strong coupling in the Theta frequency and significant decoupling in the mid Beta range (upper). While more variable, neither error trial type showed significant coupling or decoupling (lower). D. Criterion Reversal: While increasing from chance, win-stay trials showed no significant coupling or decoupling while lose-shift trials now showed significant decoupling in all frequencies (upper). Regressive errors now had significant decoupling across Beta and Gama frequencies, while non-measurable coupling response was seen to perseverative trials (lower). Dotted Lines mark boundaries of frequency ranges of theta (θ, 4–10 Hz), beta (β, 10–30 Hz) and gamma (γ, 30–40 Hz). Data are means ±SEM. Colored lines indicate the frequency ranges of significance for the corresponding color trial types. *= significant difference (P<.05) from chance as calculated by two standard deviations away from random shuffled distribution of the data (grey bar).

