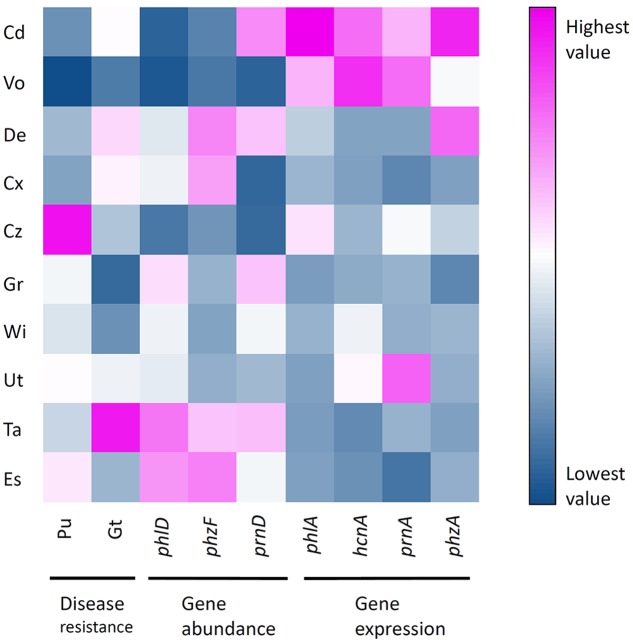
FIGURE 6.
Heatmap showing normalized-values of disease resistance, antimicrobial gene abundance and antimicrobial gene expression measured in 10 representative Swiss agricultural soils with a cereal-oriented cropping history. The color scale depicts highest (fuchsia) via intermediate (white) to lowest (blue) values for each variable. Sampling sites: Cd, Cadenazzo; Cx, Courtedoux; Cz, Cazis; De, Delley; Es, Eschikon; Gr, Grangeneuve; Ta, Taenikon; Ut, Utzenstorf; Vo, Vouvry; Wi, Witzwil.

