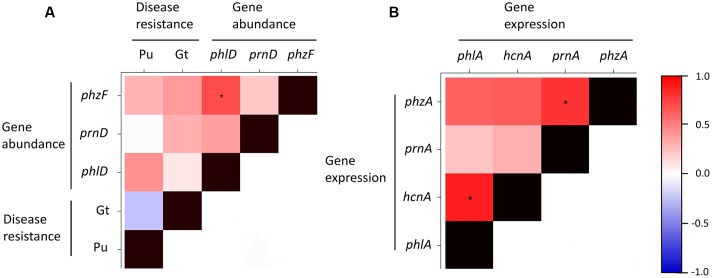
FIGURE 7.
Heatmap showing Spearman’s rank correlations for disease resistance and abundance of antimicrobial genes (A) and for expression levels of antimicrobial genes (B) in 10 representative Swiss agricultural soils with a cereal-oriented cropping history. The abundance of antimicrobial genes is defined as the number of bacterial cells harboring the indicated gene. Significant correlations (p < 0.05) are highlighted with asterisks. The color scale to the right of the matrix indicates rho correlation coefficients.

