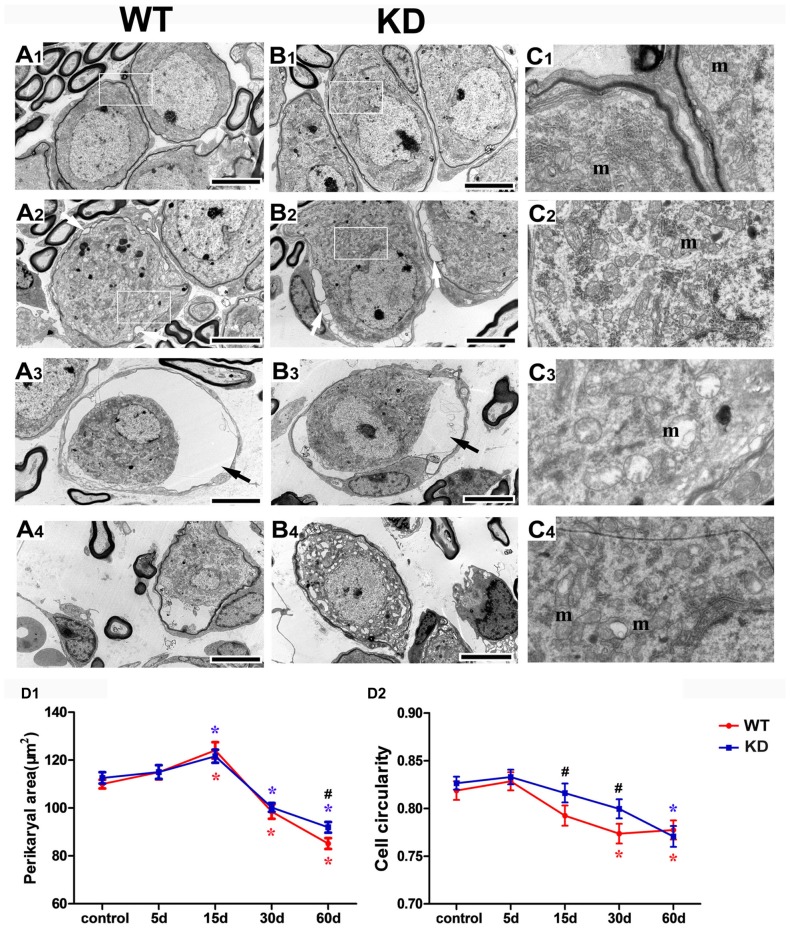
Figure 4.
Efr3a reduction ameliorated the structural alterations of SGNs following hair cell loss. Representative transmission electron microscope (TEM) images of the SGNs in the cochlea from WT and Efr3a KD (KD) mice without (A1,B1) and with drugs treatment at the 15th (A2,B2), 30th (A3,B3) and 60th (A4,B4) day posterior to drugs application. (C1–C4) is a close view of the boxed areas in (A1,B1,A2,B2) respectively. White arrows indicate the cytoplasmic vacuoles gathered at the edge of the cytoplasm of the SGNs, with a few swelling and scattered mitochondria (m), while black arrows indicate the balloon-like appearance around the perikarya of SGNs. Scale bar = 5 μm in (A1–A4) and (B1–B4). Quantitative time-course analysis of the perikaryal area (D1) and cell circularity (D2). Data are represented by mean ± SEM, n ≥ 100 SGNs for each data point, unpaired T-test (two tail) or Mann-Whitney test between WT and KD group at the same time point, and one-way ANOVA testing followed by Dunnett post hoc testing between experimental and control group within WT and KD mice. Blue “*” indicates p < 0.05 compared with control in Efr3a KD mice, red “*” indicates p < 0.05 compared with control in WT mice, and black “#” indicates p < 0.05 between Efr3a KD and WT mice in each time point. WT vs. Efr3a KD: p = 0.038 at the 60th day for perikaryal area, p = 0.026 at the 15th day and p = 0.018 at the 30th day for cell circularity.

