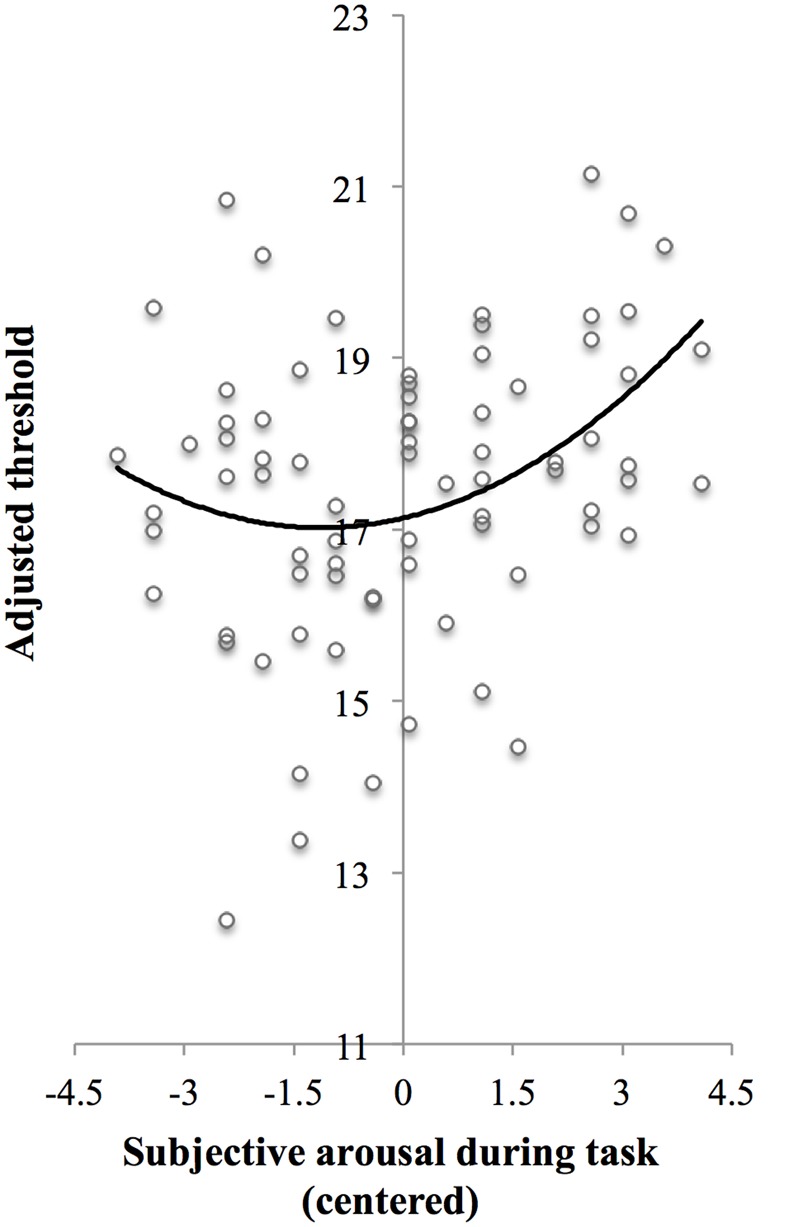
FIGURE 3.

Scatter plot of adjusted threshold versus centered subjective arousal for Experiment 1. To be able to visualize the threshold as a function of arousal while controlling for baseline threshold, threshold scores were adjusted as follows: The threshold scores were fitted to a regression model Y ′ = B0 + B1X1 + B2X2 + B3, where Y′ is predicted test threshold, X1 is baseline threshold, and X2 is centered subjective arousal [regression coefficients (B) are presented in Step 3 in Table 3]. Next, the threshold scores (Y) were adjusted so that Y adjusted = Y-B1X1. The solid curve shows the quadratic polynomial regression line of adjusted threshold on centered arousal scores, thus representing Yadjusted′ = B0 +B2X2 +B3X22.
