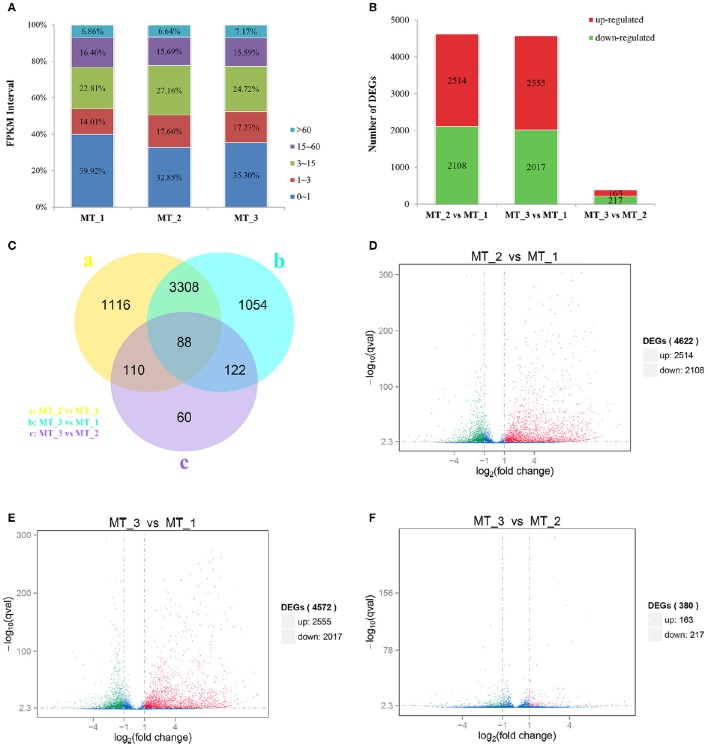
Figure 4.
Distribution of genes with differential expression in MT_1, MT_2, and MT_3 libraries. (A) Statistics of FPKM-value and percentage of the identified DEGs in three libraries. (B) Number of DEGs in the three libraries. (C) Unique and common DEGs among the three libraries. (D,E,F) Volcano plot of gene expression differences in pairs of MT_2 vs. MT_1, MT_3 vs. MT_1, and MT_3 vs. MT_2, respectively.

