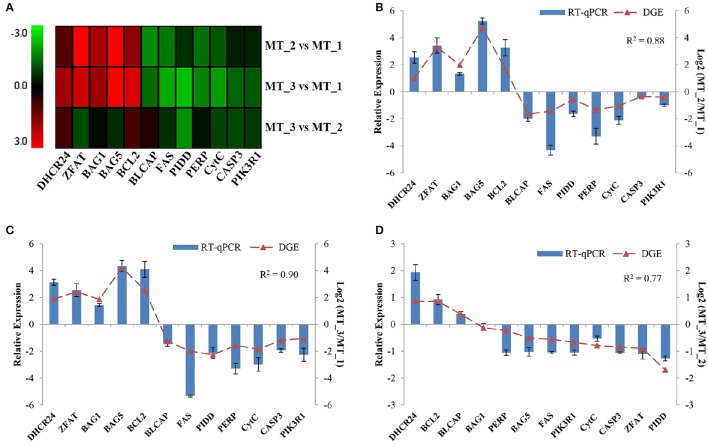
Figure 5.
Expression profiling of critical DEGs during spermatogenesis in P. sinensis. (A) Heat map diagrams of expression patterns of DEGs among the three libraries. The red and green bars indicate up- and down-regulated genes, respectively. The relative expression levels of DEGs between MT_2 vs. MT_1 (B), MT_3 vs. MT_1 (C), and MT_3 vs. MT_2 (D) were analyzed by RT-qPCR analysis.

