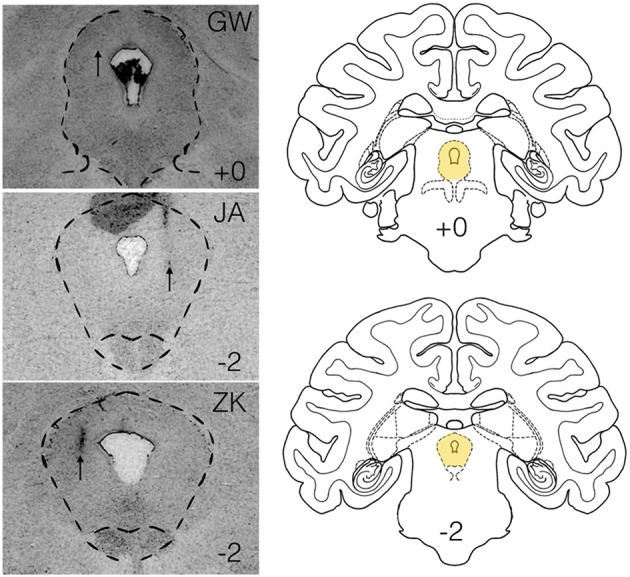
Figure 1.

Histological verification of infusion sites within the lateral PAG. Panels on the left show infusion sites in the periaqueductal gray of the three subjects (GW, JA, ZK). Outlined region shows the PAG. Atlas panels on the right show the level of infusion sites for GW and JA (top, +0) and ZK (bottom, −2) relative to the intra-aural line. Atlas panels are from the National Institute of Mental Health/Laboratory of Neuropsychology standard Rhesus Macaque atlas.
