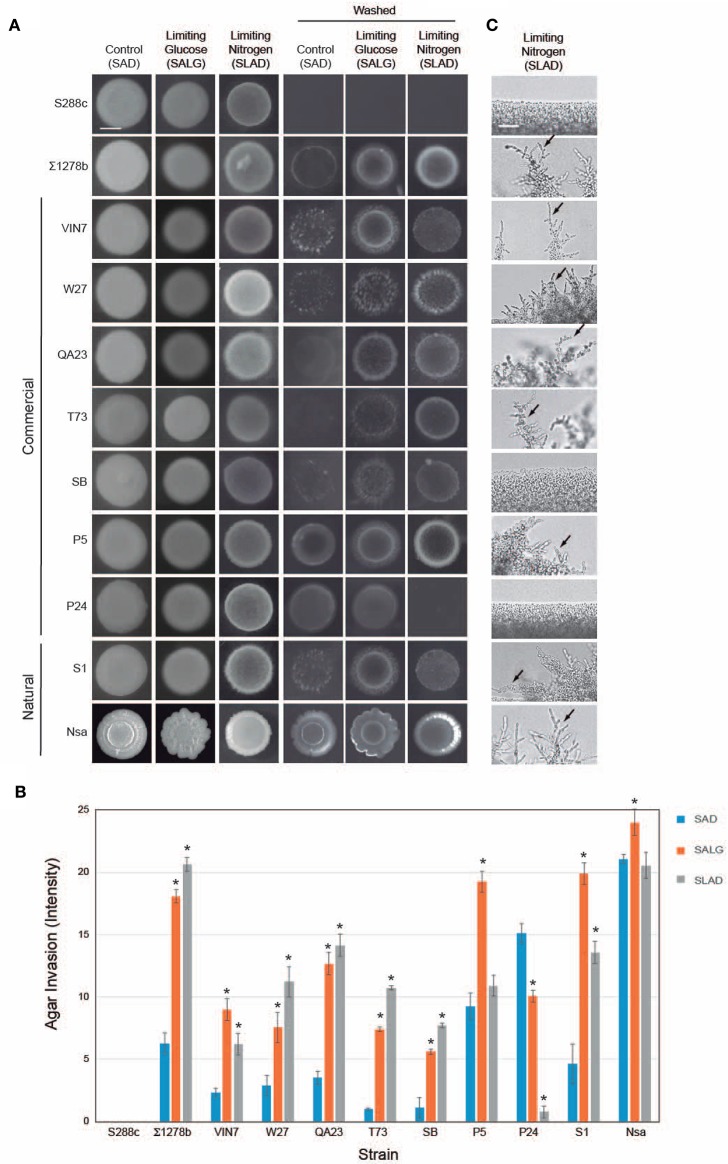
Figure 1.
Filamentous growth phenotypes of wine strains. (A) Plate-washing assay (PWA). Equal concentrations of cells (OD600 nm = 2) were spotted in 10 μL aliquots onto the indicated media. Plates were incubated for 5 days at 30°C and washed in a stream of water. Bar, 5 mm. (B) Quantitation of invasive growth in panel (A) by densitometry. Cells were spotted in triplicate, and the average values are shown. Error bars represent the standard difference between experiments. Asterisk denotes a p < 0.01 for samples relative to each strain's invasion in SAD. (C) Pseudohyphal growth of micro-colonies. Cells were grown for 3 days in minimal medium (MM) at 30°C, diluted by a factor of 106 and spotted onto SLAD media. Plates were incubated for 5 days. Colonies were examined by microscopy at 40X magnification. A representative image is shown. Bar, 25 μm. Arrows mark examples of pseudohyphae.

