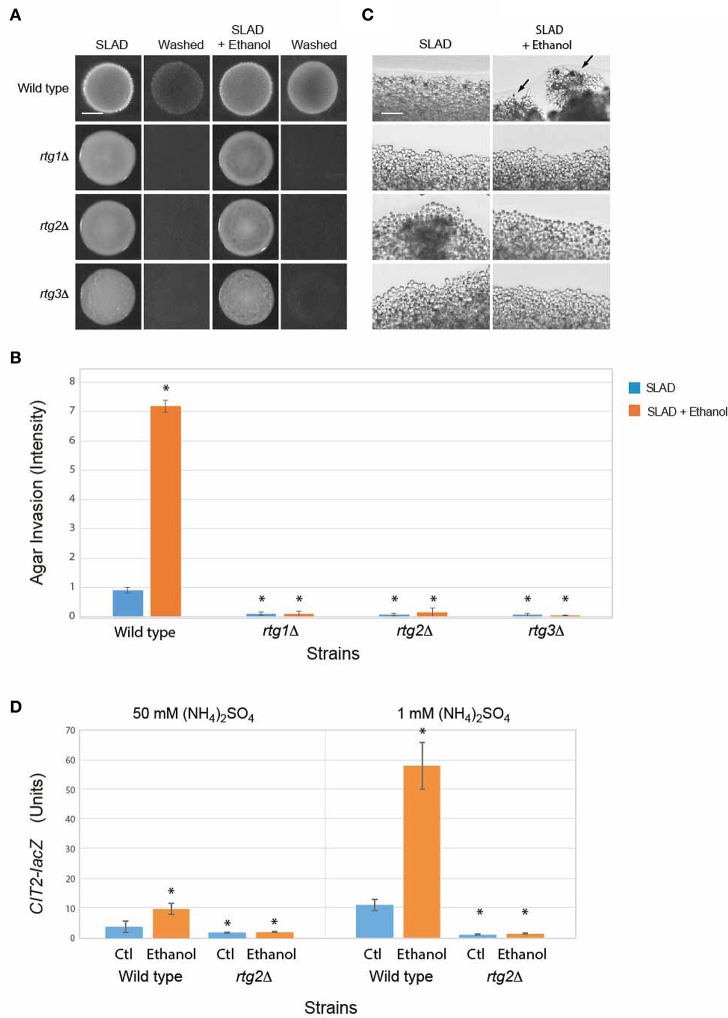
Figure 4.
Role of the RTG pathway in regulating ethanol-inducible invasive growth. (A) Wild-type cells (PC538, Σ1278b MATa haploid) and the indicated isogenic mutants were spotted onto nitrogen limiting medium (SLAD) with or without 2% ethanol (v/v). Plates were incubated for 4 days at 30°C, photographed, washed in stream of water, and photographed again. Bar, 5 mm. (B) Quantitation of invasive growth in panel (A) by densitometry, performed as described in the legend for Figure 1B. Cells were spotted in triplicate, and the average values are shown. Error bars represent the standard difference between experiments. Asterisk denotes a p < 0.01 for samples relative to wild type in SLAD. (C) Colony peripheries from the plates in panel (A) were examined by microscopy at 20X magnification. Bar, 50 μm. Arrows mark examples of pseudohyphae. (D) Beta-galactosidase activity of the CIT2-lacZ reporter in wild-type cells and the rtg2Δ mutant grown in 1 or 50 mM (NH4)2SO4 with or without 2% ethanol (v/v). Experiments were performed in triplicate from independent inductions. Error bars represent the standard deviation between experiments. Asterisk denotes a p < 0.01 for samples relative to wild type in media lacking ethanol (Ctl).

