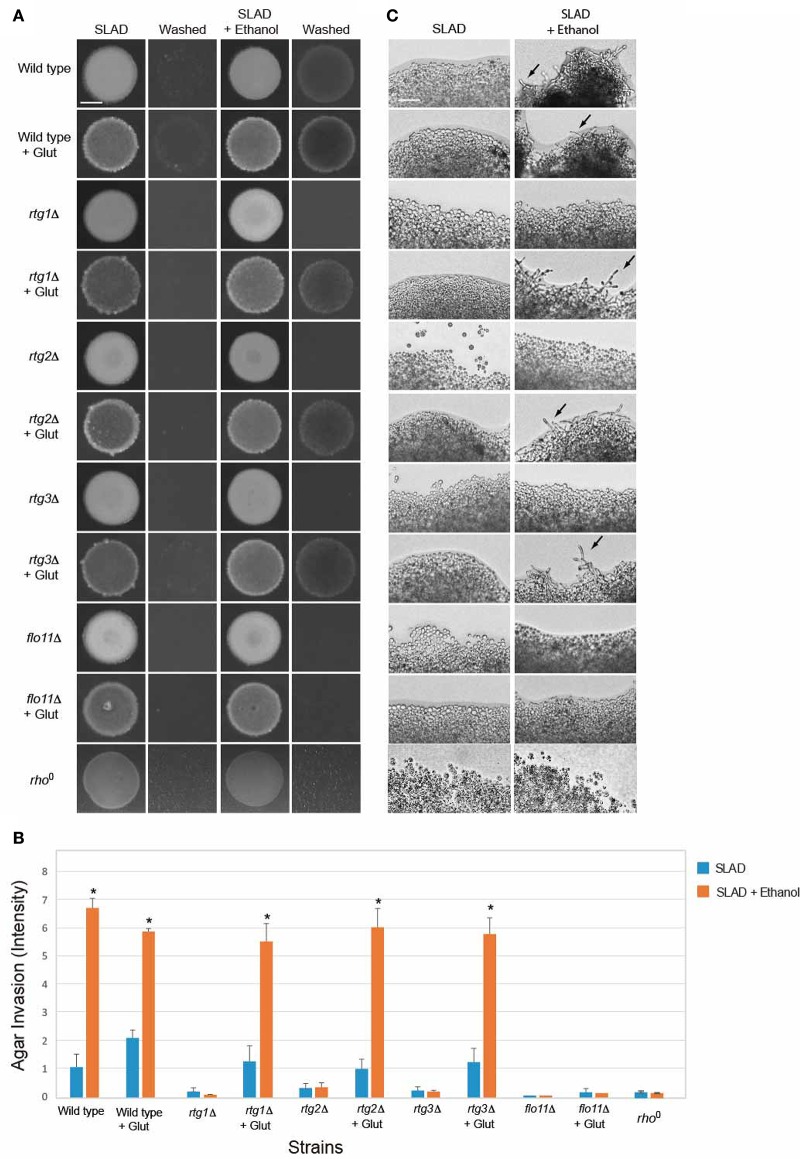
Figure 6.
Impact of glutamate on ethanol-inducible invasive growth defect of rtg mutants. (A) Wild-type cells (PC538, Σ1278b MATa haploid) and the indicated isogenic mutants were spotted onto nitrogen limiting medium (SLAD) with or without 2% ethanol (v/v). Plates were incubated for 4 days at 30°C, photographed, washed in stream of water, and photographed again. Bar, 5 mm. Glutamate was added at a concentration of 200 μM. (B) Quantitation of invasive growth in panel (A) by densitometry. Cells were spotted in triplicate, and the average values are shown. Error bars represent the standard difference between experiments. Asterisk denotes a p < 0.05 for samples relative to each strain's invasion in SLAD. (C) Colony peripheries from the plates in panel (A) were examined by microscopy at 20X magnification. Bar, 50 μm. Arrows mark examples of pseudohyphae.

