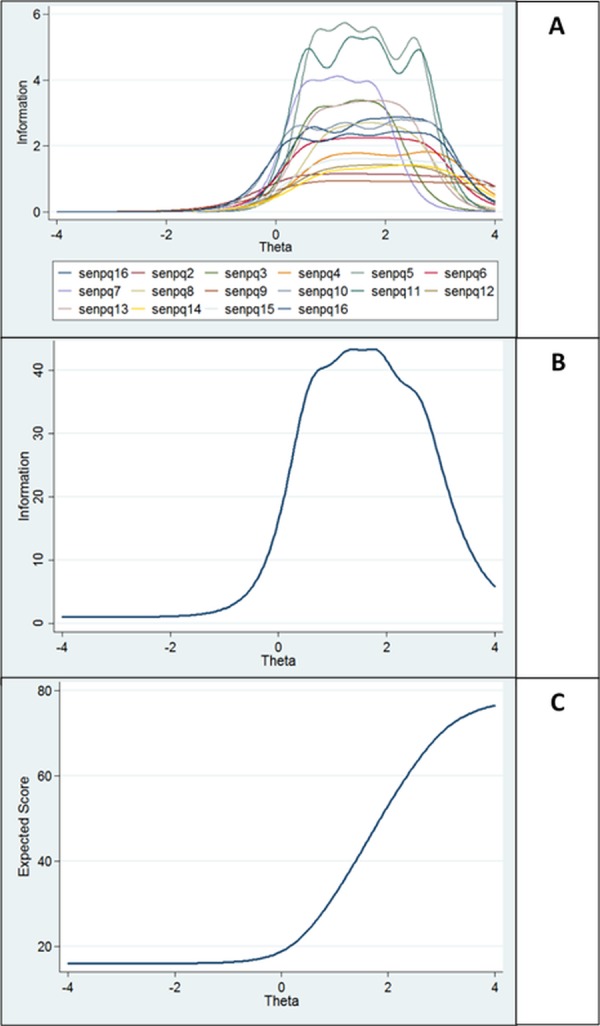
Figure 2. Item response theory graphical analyses at the test and item level of the SenPQ.

Item information function (A), Test information function (B), and Test characteristic curve (C).

Item information function (A), Test information function (B), and Test characteristic curve (C).