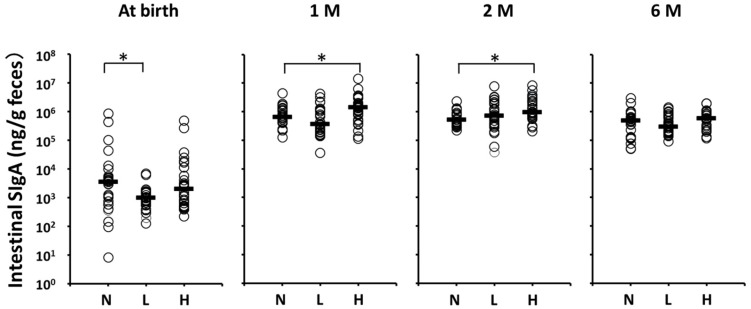
Figure 3.
Fecal SIgA levels of the per-protocol population at each month after birth. Horizontal lines represent median values. * Statistically different based on a Dunnett test (p < 0.05). N vs. L at birth, p = 0.024; N vs. H at one month of age, p = 0.031; N vs. H at two months of age, p = 0.0055. 1 M = one month of age; 2 M = two months of age; 6 M = six months of age; N = no intervention control; L = live OLB6378; H = non-live OLB6378.

