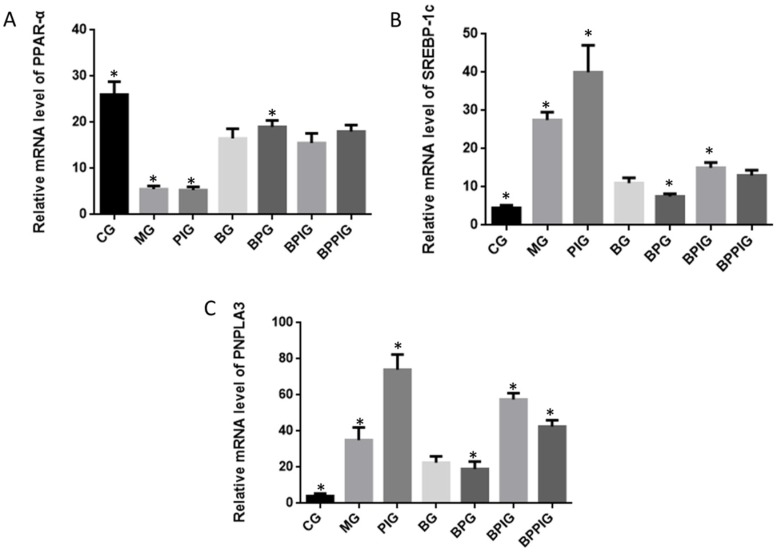
Figure 8.
Real-time quantitative RT-PCR analysis of the mRNA levels of SREBP-1c/PNPLA-3 pathway and its interacting molecules. (A) Relative mRNA level of PPAR-α; (B) Relative mRNA level of SREBP-1C; (C) Relative mRNA level of PNPLA3. Eight liver samples were analyzed in each group. All data are presented as mean value ± S.D. * p < 0.05 via a blueberry juice group BG.

