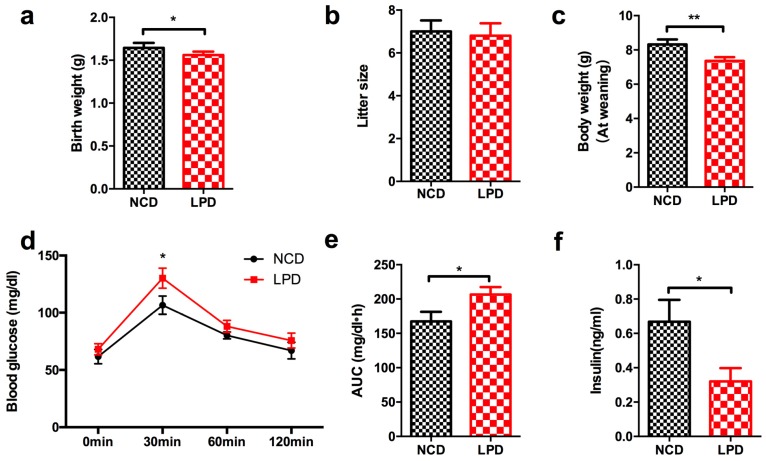
Figure 2.
Metabolic profile and serum insulin concentration in offspring at weaning. (a) Birth weight; (b) litter size; (c) body weight at weaning; (d) intraperitoneal glucose tolerance test; (e) area under curve (AUC) of glucose tolerance test; and (f) serum insulin level. Data represented as the mean ± SEM (n = 6 to 8, per group). * p < 0.05, ** p < 0.01 vs. the NCD group. LPD, low-protein diet; NCD, normal chow diet.

