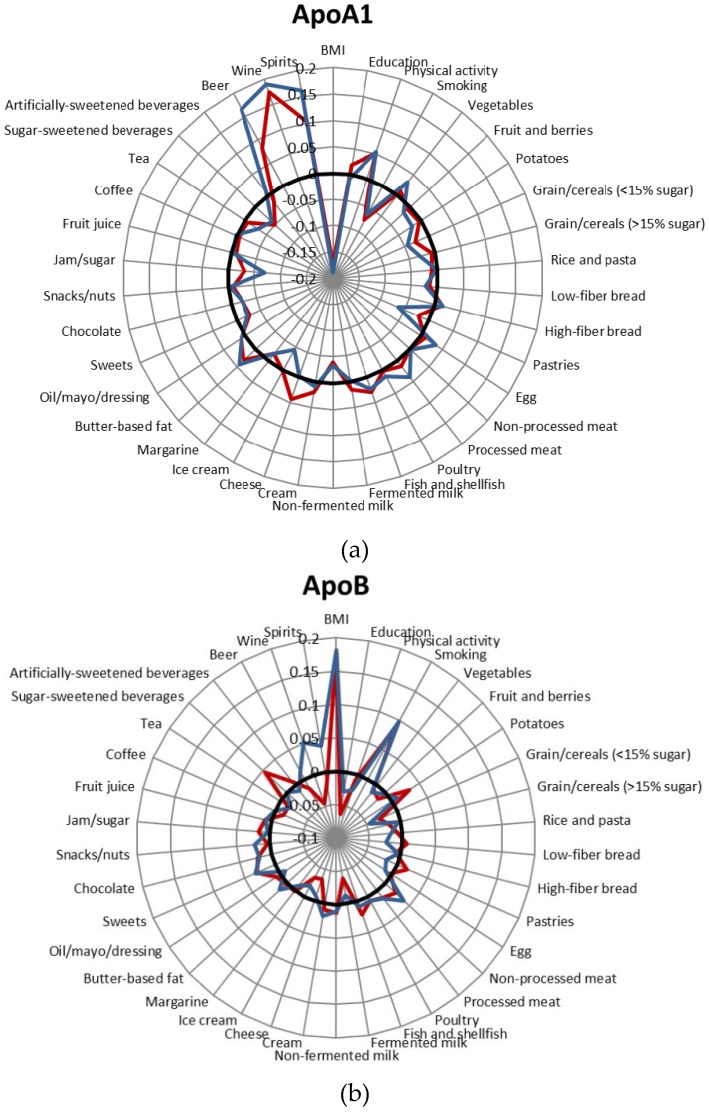
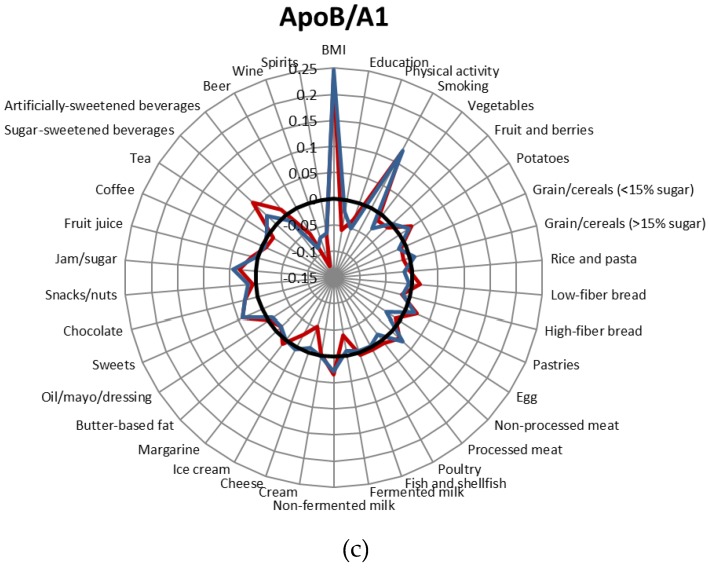
Figure 1.
Correlations between lifestyle factors and food intake and ApoA1 concentrations (a), ApoB concentrations (b) and the ApoB/ApoA1 ratio (c). Blue: men; red: women; black: r = 0. Adjusted for age, screening date, total energy intake, BMI, leisure-time physical activity, alcohol and smoking habits. The analyses including beer, wine and spirits were not adjusted for alcohol.


