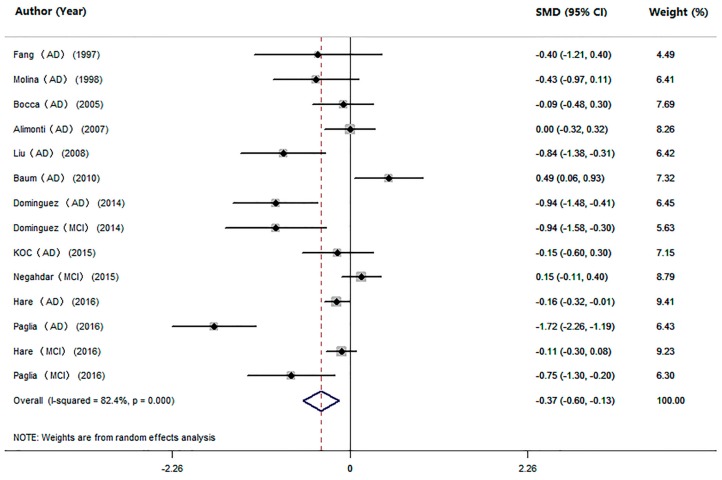
Figure 4.
Forest plot for serum Mn levels in patients with cognitive impairment and health controls in included studies. The rhombus represents the combined effect estimates. The size of grey box is positively proportional to the weight assigned to each study, and horizontal lines represent the 95% confidence interval (CI).

