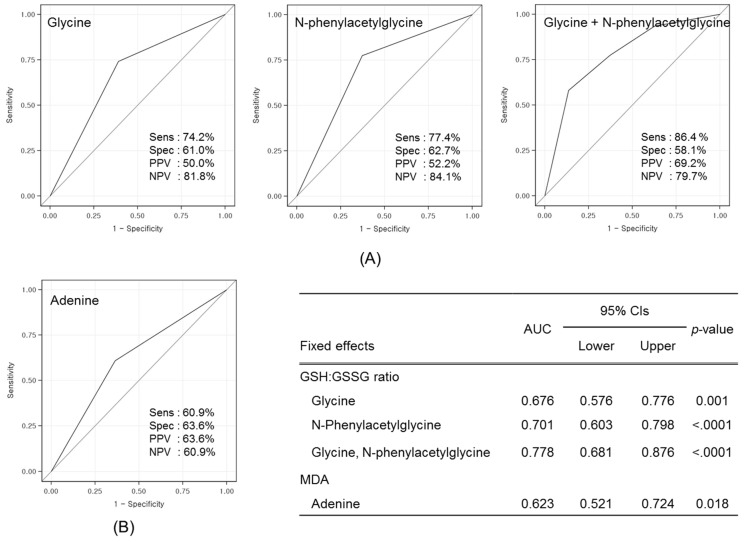
Figure 3.
ROC curves of three single metabolite and a two-metabolite set for predicting changes in traditional biomarkers: (A) erythrocyte GSH:GSSG ratio; and (B) plasma MDA level. The gray diagonal line represents the reference line of 0.5. Sensitivity, specificity, PPV, and NPV are shown in each box, and AUC, CI, and p-value are presented in the inset. ROC, receiver operating characteristic; GSH, glutathione; GSSG, oxidized glutathione; MDA, malondialdehyde; PPV, positive predictive value; NPV, negative predictive value; AUC, area under the curve; CI, confidence intervals.

