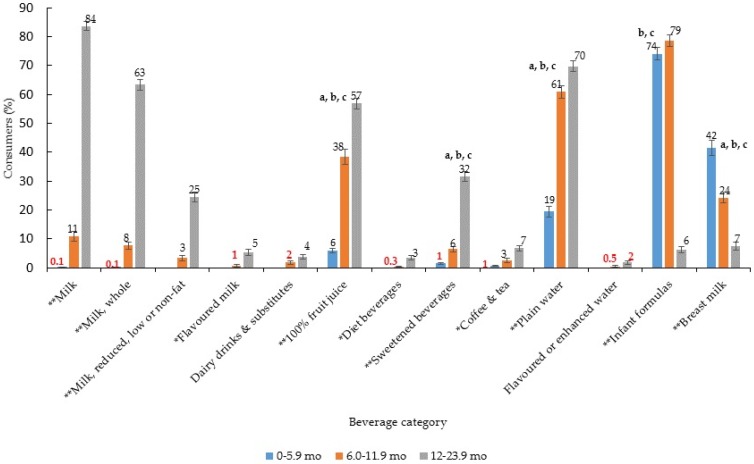
Figure 1.
Proportion (%) of children consuming each type of beverage by age group (n = 2740) 1,2,3,4,5. 1 Error bars represent ± 1 SE. Those bolded in red are statistically unreliable, relative standard error ≥30% [24]; 2 Chi-square test to assess difference in proportions, * p < 0.01, ** p < 0.001. Where significant, logistic regression with Bonferroni adjustment for multiple comparisons was used to assess differences between sub-groups; a 0–5.9 months vs. 6.0–11.9 months p < 0.05; b 0–5.9 months vs. 12.0–23.9 months p < 0.05; c 6.0–11.9 months vs. 12.0–23.9 months p < 0.05; 3 As only n = 1 consumer of milk in 0–5.9 months, sub-group differences only assessed between 6.0–11.9 months and 12.0–23.9 months; 4 As n = 0 consumers in 0–5.9 months for flavoured milk, dairy drinks and substitutes, diet beverages and flavoured or enhanced water, differences in intake only assessed in 6.0–11.9 months and 12.0–23.9 months; 5 On the day of the 24-h dietary recall there were 2544 instances of plain water consumed across 1526 participants. n = 1700 (66.8%) of these instances were consumed in isolation, n = 650 (25.6%) were consumed as an addition to a beverage (e.g., water added to fruit juice), 7.3% instances were combined as an addition to cereal (e.g., dry, instant, rice cereal, baby food) and 0.3% were consumed with other food additions (e.g., added to fruit puree).

