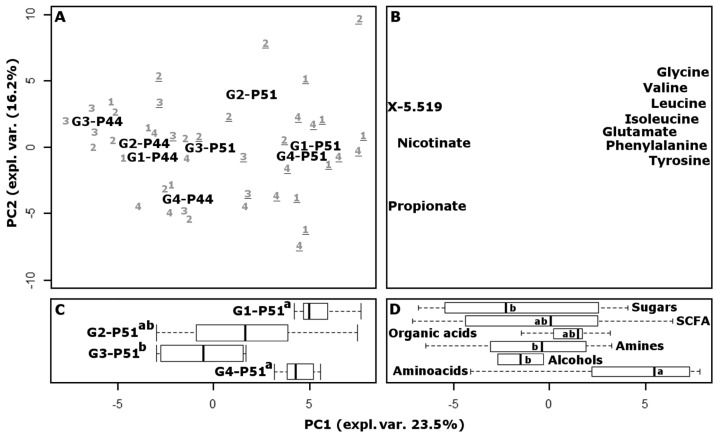
Figure 3.
Score plot (A) of a PCA analysis of fecal metabolome. To facilitate the visualization of the differences of the samples at P51, their scores along PC1 are summarized by boxplots (C); Corresponding loading plot (B), in which only the 10 most important variables, as calculated by sPCA, are reported. The 81 loadings are also summarized by the molecular group in panel (D). In panels (C,D), different lowercase letters indicate statistically different groups (p < 0.05). (G1, G2, G3, G4 refer respectively to the groups fed with: microencapsulated iron bread (FeMB-G1); bread containing the same quantity of iron sulphate; starch and citric acid (FeSB-G2); control bread (CB-G3), and control bread with IM iron supplements at P5 (CB-G4)).

