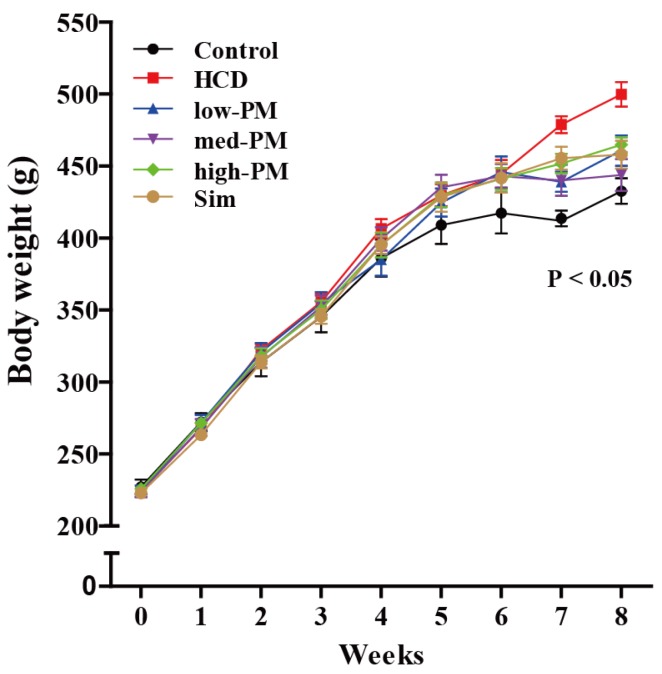
Figure 1.
Body weight (BW) changes during experimental procedure. Rats were divided into control, high cholesterol diet (HCD)-fed, and PM-treated groups (n = 10 per group). BW was measured once a week in each group. p-value for ANOVA for repeated measures is given. HCD, high cholesterol diet-fed group; low-, med-, and high-PM: low (1.65 × 10⁹ cfu/kg/day), medium (5.5 × 10⁹ cfu/kg/day), and high doses (1.65 × 10¹⁰ cfu/kg/day) of probiotic mixture-treated group, respectively.

