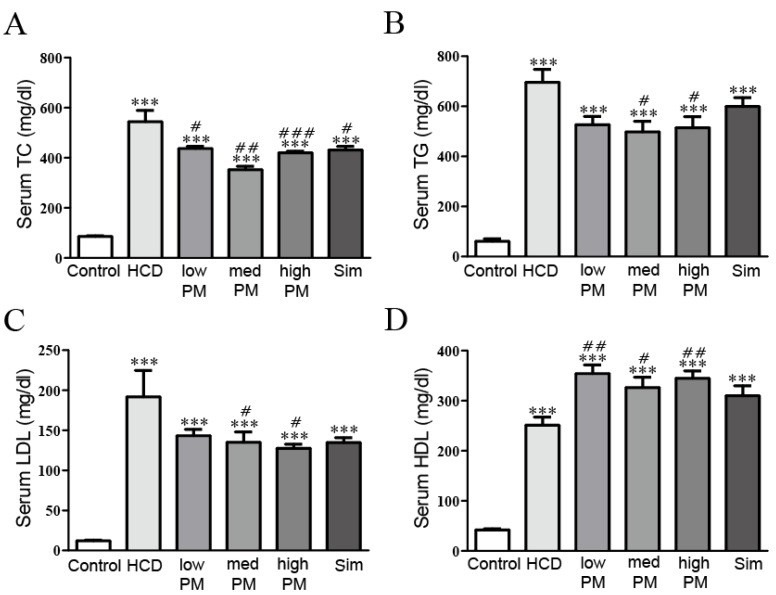
Figure 2.
Effects of PM treatment on serum levels of (A) TC, (B) TG, (C) LDL-cholesterol, and (D) HDL-cholesterol in hypercholesterolemic rats. Data are expressed as mean ± SEM. Significance was measured by performing a one-way ANOVA followed by Bonferroni’s post-hoc test. *** p < 0.005 vs. control. # p < 0.05, ## p < 0.01, ### p < 0.005 vs. HCD-fed group. HCD, high cholesterol diet-fed group; low-, med-, and high-PM: low (1.65 × 10⁹ cfu/kg/day), medium (5.5E × 109 cfu/kg/day), and high doses (1.65 × 10¹⁰ cfu/kg/day) of probiotic mixture-treated group, respectively; Sim, simvastatin-treated group; TC, total cholesterol; TG, triglycerides; LDL, low-density lipoprotein cholesterol; HDL, high-density lipoprotein cholesterol.

