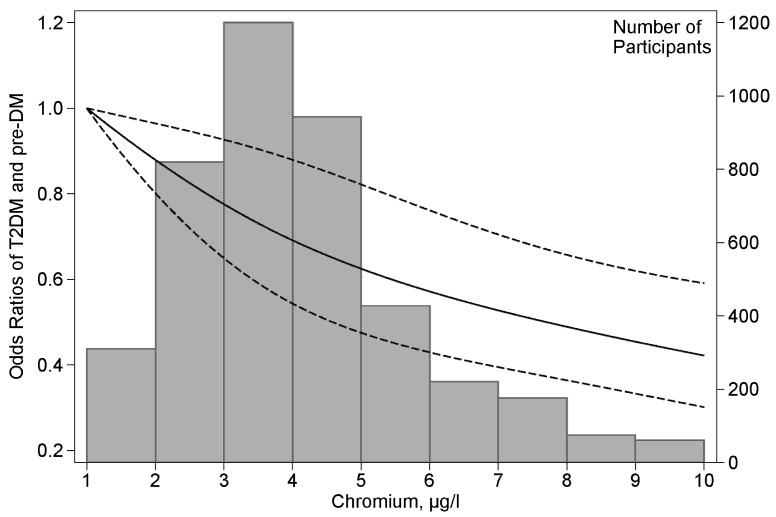
Figure 1.
Odds ratios of T2DM and pre-DM by plasma chromium concentrations. Lines represent odds ratios (95% CIs) based on restricted cubic splines for plasma chromium concentrations with knots at the fifth, 50th, and 95th percentiles. Odds ratios were estimated using a logistic regression model after adjustments for age, sex, BMI, current smoking status, current alcohol drinking status, family history of diabetes and hypertension. Bars represent the numbers of participants; nine equally sized bins were selected from the second to the 98th percentiles of chromium distribution.

