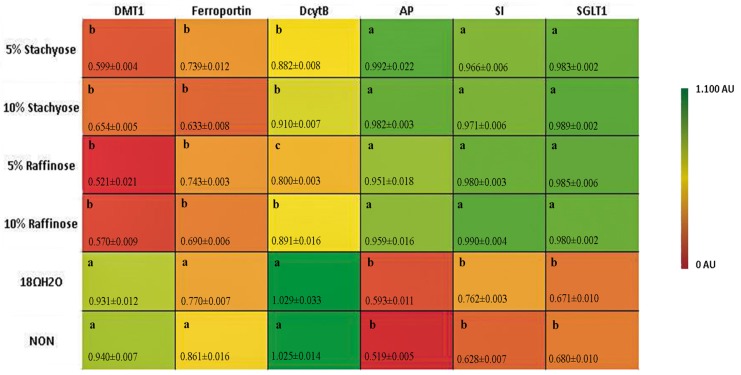
Figure 2.
Duodenal mRNA expression (in AU) of measured brush border membrane (BBM) functional and Fe metabolism genes on the day of hatch. Values are means ± SEM, n = 8. Standard errors are represented by vertical bars. Per gene, treatments groups not indicated by the same letter are significantly different (p < 0.05). AP: aminopeptidase; SI: sucrase isomaltase; SGLT1: sodium glucose cotransporter-1.

