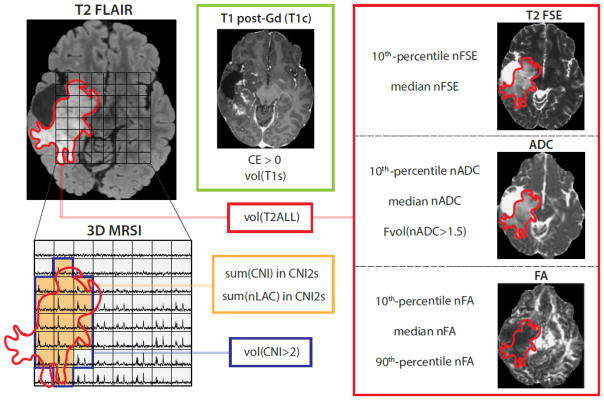
Figure 1.
Quantification of MR parameters used in the present analysis. nADC, FA, and FSE intensity percentiles are calculated within the T2 Flair hyperintensity (T2ALL) ROI. In the MRSI image, the blue line delineates voxels with CNI>2, while the green-shaded region (volCNI2) identifies voxels where CNI>2 voxels overlap or are tangent to T2ALL (CNI2s). The integrated sums of CNI (sumCNI) and nLac (sumLac) values from voxels within the CNI2 that were intersecting or at least tangent to the T2ALL were used as measures of abnormal metabolic features of the tumor.

