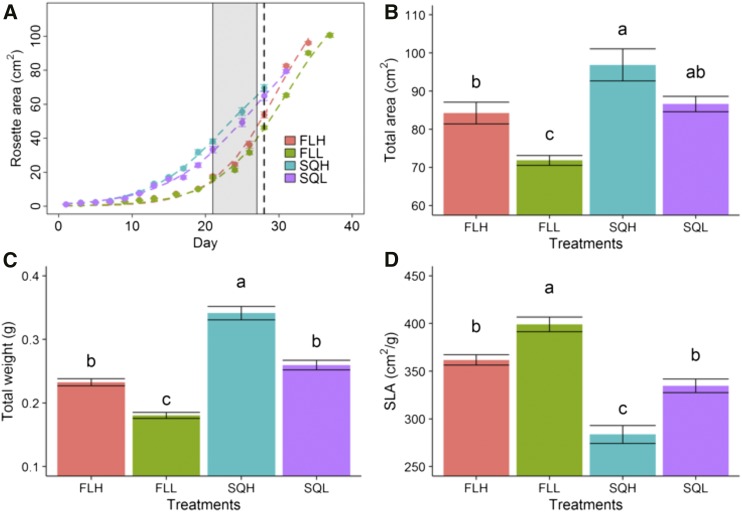
Figure 8.
Growth analysis of plants grown under the four light regimes SQH, FLH, SQL, and FLL. A, Kinetics of the increase in rosette area, with each point representing a mean of 10 plants. The gray area represents the period during which gas-exchange measurements were taken. The dotted line indicates the time of harvest for all treatments. The last point of each curve was measured upon the appearance of the first inflorescence. B to D, Total leaf area of each plant (B), total aboveground dry mass (C), and specific leaf area (SLA; D). Data represent means ± se (n = 8–10). Letters represent the results of Tukey’s posthoc comparisons of group means.

