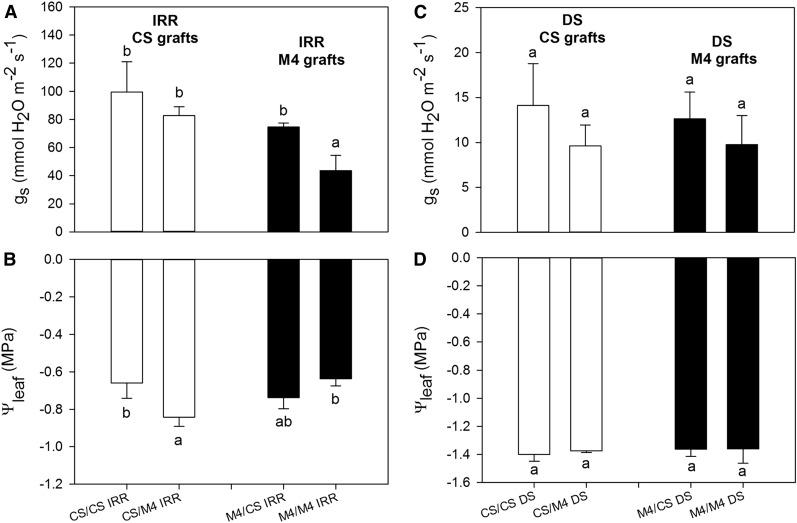
Figure 1.
Measurements of gs (A and C) and Ψleaf (B and D) in autografted and heterografted plants of CS and M4 genotypes in irrigated conditions (IRR; A and B) and after 10 d of DS (C and D). Lowercase letters above and below the bars denote significant differences (P < 0.05) attested using Tukey’s honestly significant difference (HSD) test. Error bars represent se (n = 10).

