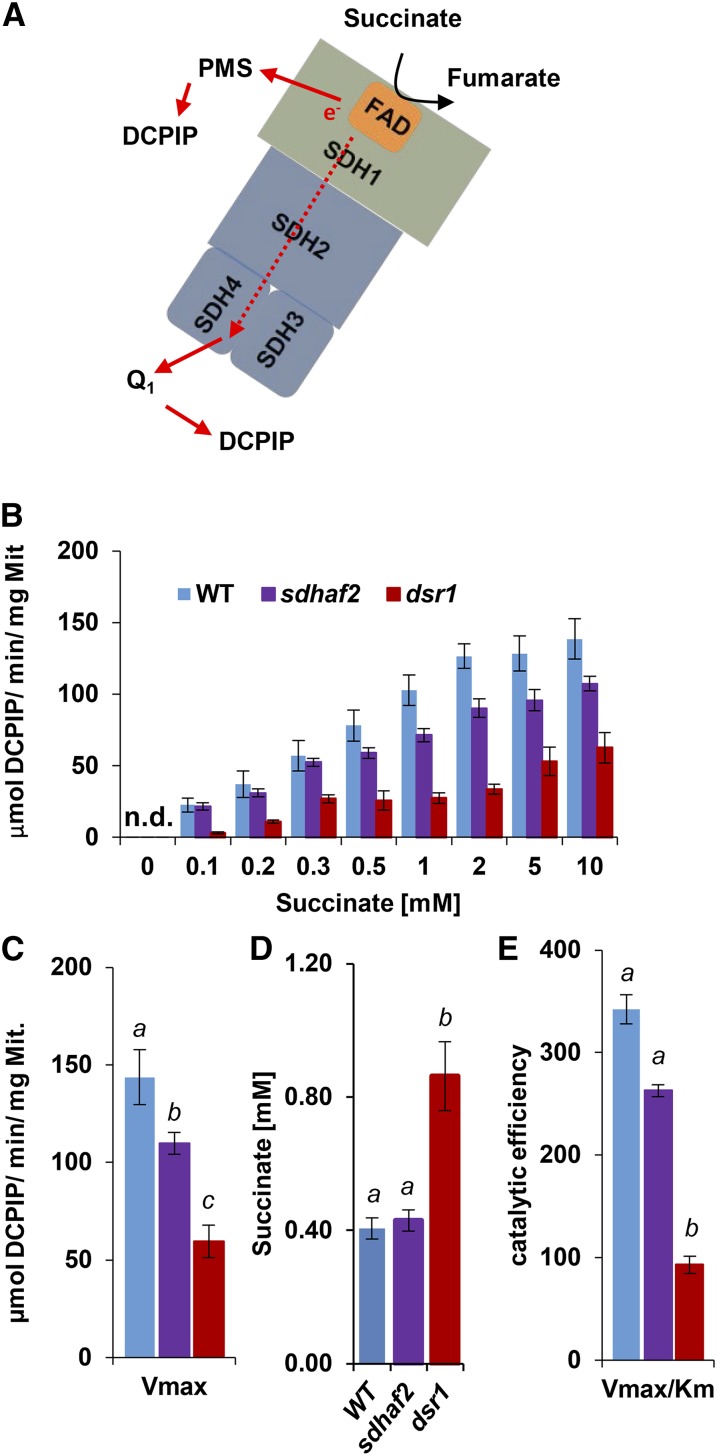
Figure 2.
Lower succinate affinity and catalytic efficiency in dsr1. Concentrations of 0.1 to 10 mm of succinate were used to calculate maximal SDH activity, measured as absorbance change of DCPIP at 600 nm. Km was calculated using Hanes-Plot and Brook Kinetics Software. A, Scheme of SDH showing electron transfer from succinate to UQ binding site. B, Correlation of SDH activity and succinate concentrations of the wild type, sdhaf2, and dsr1. C, Maximal enzyme velocity (Vmax). D, Calculated Km of succinate using Brooks kinetic software. E, enzymatic efficiency (Vmax/Km) for sdhaf2 and dsr1. se of six biological replicates. Two-factor ANOVA comparing SDH activity between genotypes (B) P ≤ 0.01 (dsr1 compared to the wild type and sdhaf2). Single-factor ANOVA comparing catalytic efficiency and succinate affinity (D and E) between genotypes. Different letters indicate significant differences (P ≤ 0.05) between genotypes. n.d., Not detected.

