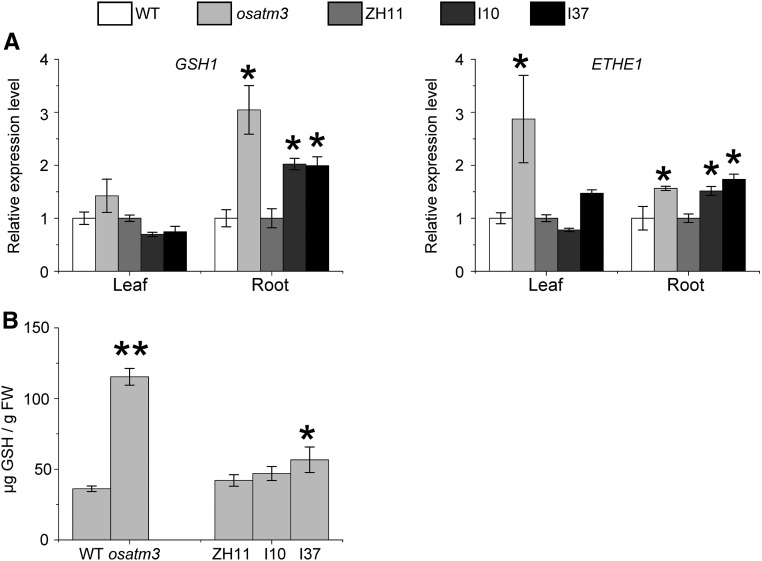
Figure 6.
GSH metabolism is impaired in osatm3 and RNAi lines. A, Quantitative RT-PCR analysis of genes encoding Glu-Cys ligase (GSH1) and sulfur dioxygenase (ETHE1) in osatm3 and RNAi lines (n = 3). B, Total GSH quantitation of seedlings (n = 3). Significance analysis was performed in comparison with the wild type using Student’s t test. *P < 0.05, **P < 0.01.

