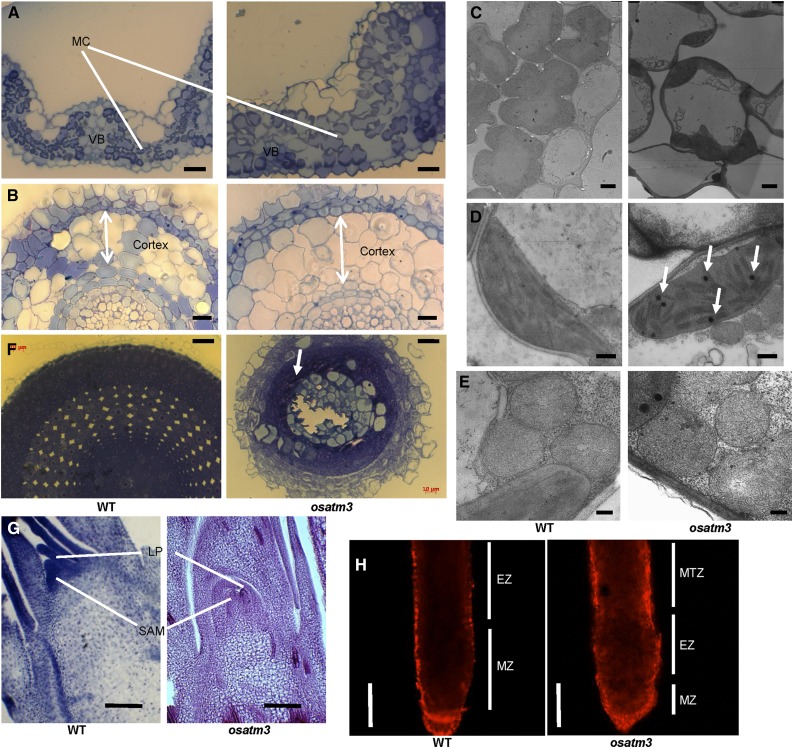
Figure 9.
Microscopic imaging of osatm3. A, Cross section of leaf blades of wild type (left) and osatm3 mutant (right). Bars = 20 µm. Eight cells were counted. B, Cross section of roots. Arrows indicate cortex thickness. Bars = 20 μm. Eight cells were counted. C, Mesophyll cells under TEM. Bars = 2 μm. D, Chloroplasts under TEM. Arrows indicate osmiophilic globules. Bars = 500 nm. E, Mitochondria under TEM. Bars = 200 nm. F, Cross section of root apex. The arrow indicates dead cells. Bars = 20 µm. G, Longitudinal section of shoot apex. Bars = 80 µm. H, PI staining of root. Bars = 200 µm. EZ, Elongation zone; MC, mesophyll cells; MTZ, maturation zone; MZ, meristem zone; VB, vascular bundles.

