Figure 2.
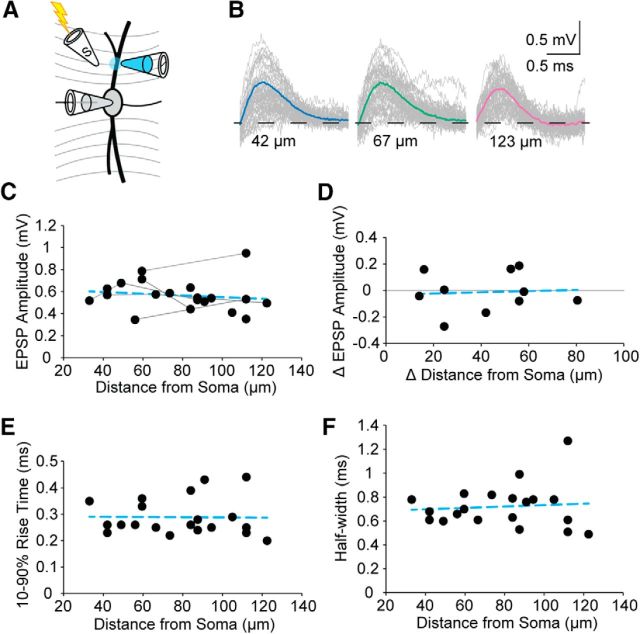
Evoked EPSPs localized by focal dendritic Ca2+ application are similar at the soma regardless of propagation distance. A, Schematic diagram showing paired Ca2+ puffing and electrical stimulation taking place in low (0.2 mm) Ca2+ ACSF. B, Representative average traces from a single neuron at 3 different dendritic Ca2+ puffing locations showing that the EPSP amplitude measured at the soma was independent of dendritic origin. C, Somatic EPSP amplitudes plotted as function of the distance propagated from the dendritic site of origin. Gray lines connect measurements obtained from the same cell. Blue dashed line indicates linear fit; slope = −0.0008 mV/μm, Y0 = 0.63 mV, R2 = 0.02, n = 20. D, The change in EPSP amplitude plotted relative to the change in distance from the soma for Ca2+ puffing recordings that sampled multiple locations on the same cell. Gray line is at 0 mV change. Points above this line indicate an increased amplitude with increased distance from the soma. Points below the line indicate a decrease. Blue dashed line indicates linear fit; slope = 0.0004 mV/μm, Y0 = −0.03 mV, R2 = 0.00, n = 10 comparisons. E, The 10%–90% rise time for responses in C. Blue dashed line indicates linear fit; slope = 0.0000 mV/μm, Y0 = 0.3 ms, R2 = 0.00, n = 20. F, Half-width for responses in C. Blue dashed line indicates linear fit; slope = 0.0006 mV/μm, Y0 = 0.7 ms, R2 = 0.01, n = 20.

