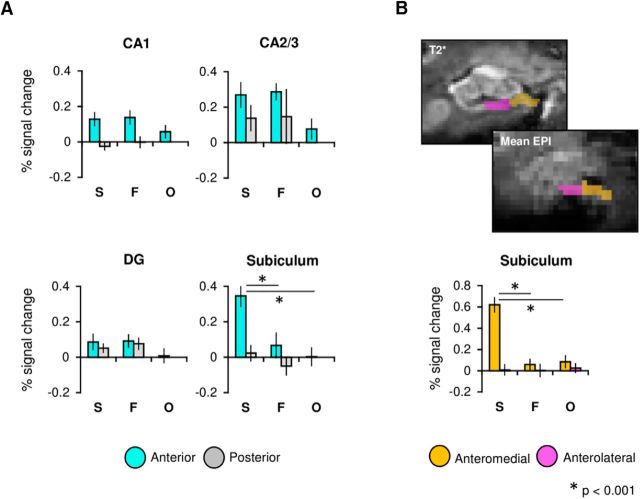
Figure 3.
A, Percentage signal change plots for anterior and posterior subdivisions within each hippocampal subfield ROI (CA1, CA2/3, DG, and subiculum). B, Example ROIs for the anteromedial and anterolateral subiculum shown on both the ultra-high-resolution T2* image and the mean EPI image of a single subject (top). Percentage signal change plot for the medial and lateral subdivisions of the anterior subiculum (bottom). Mean values (across subjects and task runs) are shown for scenes (S), faces (F), and objects (O). Error bars represent ± SE.

