Figure 3.

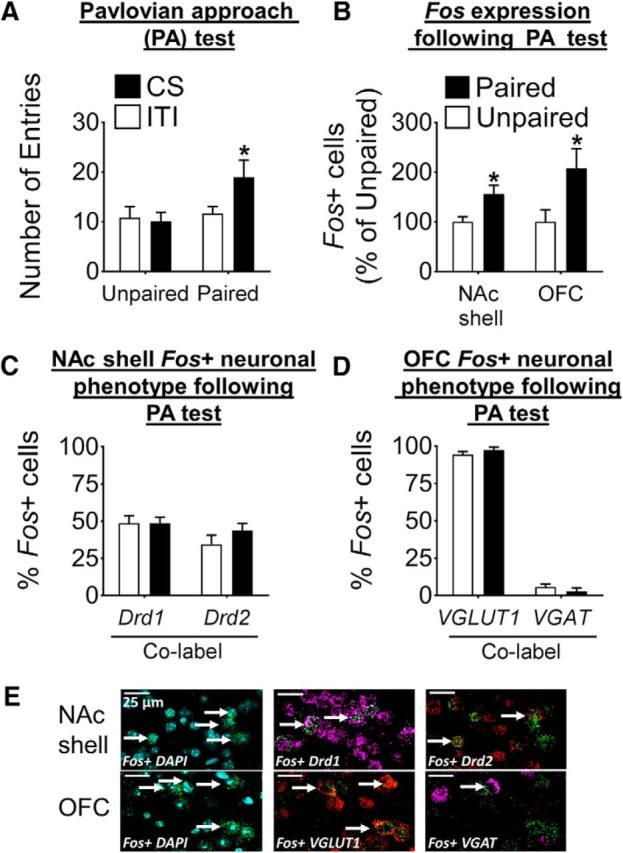
Characterization of activated neurons in the NAc shell and OFC after Pavlovian approach responding. A, Head entries of mice used in in situ hybridization experiments at test (n = 11–12/group; *p < 0.05). B, Fos expression in the NAc shell and OFC after Pavlovian approach test expressed as percentage of Unpaired group; Fos expression is significantly higher in the Paired compared with the Unpaired group for both areas (*p < 0.05; n = 7–11/group). C, Proportion of Fos+ neurons coexpressing either Drd1 (Fos+Drd1) or Drd2 (Fos+Drd2) in the NAc shell. D, Proportion of Fos+ neurons coexpressing either VGLUT1 (Fos+ VGLUT1) or VGAT (Fos+ VGAT). The vast majority of the Fos+ neurons are pyramidal neurons and only a small minority are interneurons. For A–D, data are expressed as mean ± SEM. E, Representative images of Fos, Drd1, and Drd2 labeling from the NAc shell (top row) and Fos, VGLUT1, and VGAT labeling from the OFC (bottom row). DAPI (blue) was used to visualize cell nuclei. White arrows indicate colabeled Fos+ cells.
