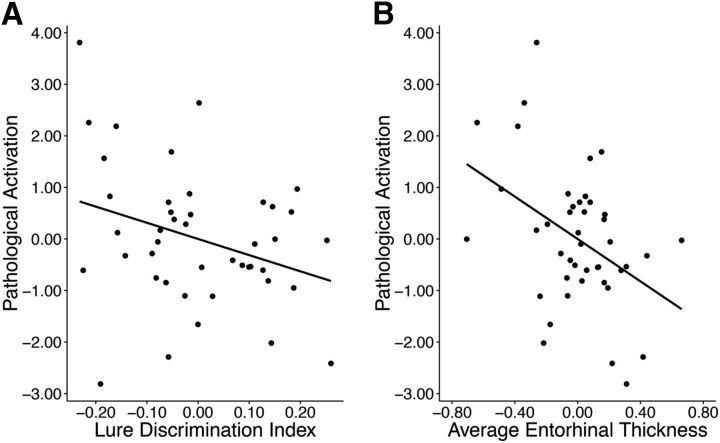
Figure 6.
Relationships between pathological activation, memory, and cortical thickness. A, Negative relationship between pathological activation (as defined by combining sH deactivations and sFA activations) and lure discrimination index (r(38) = 0.35, p = 0.05). B, Negative relationship between pathological activation and average entorhinal cortex thickness (r(38) = 0.44, p = 0.007). Data are residuals controlling for age, sex, and education.

