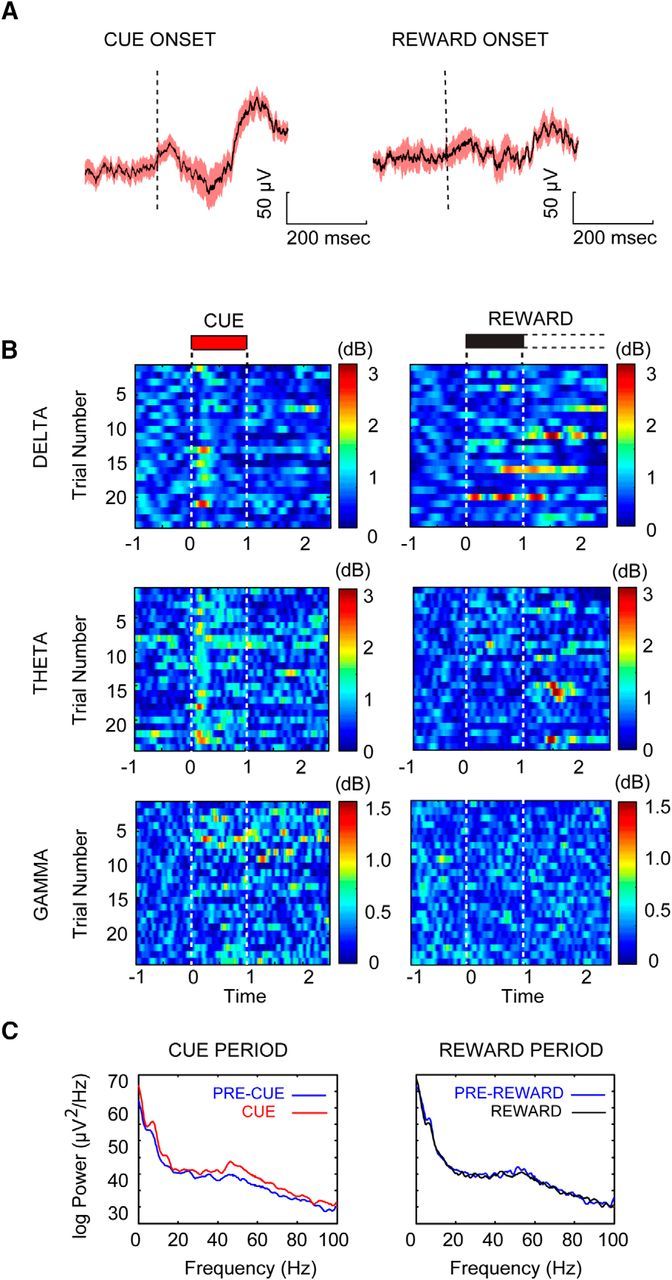
Figure 5.

Detected cues modulate power in select frequency bands. A, Averaged cue-triggered LFP aligned to cue and reward onset across trials from a single session in a single animal. B, Bandpass-filtered Hilbert-transformed LFP color plots for all detected trials (n = 24) for the cue and reward periods from a single session. Plots illustrate the three frequency bands that showed significant changes coincident with cue detection: delta (2–5 Hz), theta (7–12 Hz), and gamma (47–57 Hz). C, FFT power spectrum from all trials shown in B for the 1 s cue period (left, red) plotted in comparison to power in the 1 s window before cue (blue). The reward period is shown on the right with the FFT power representing the first second of available reward (black) compared to the 1 s prereward period (blue). Power has been Z-score normalized to the precue period.
