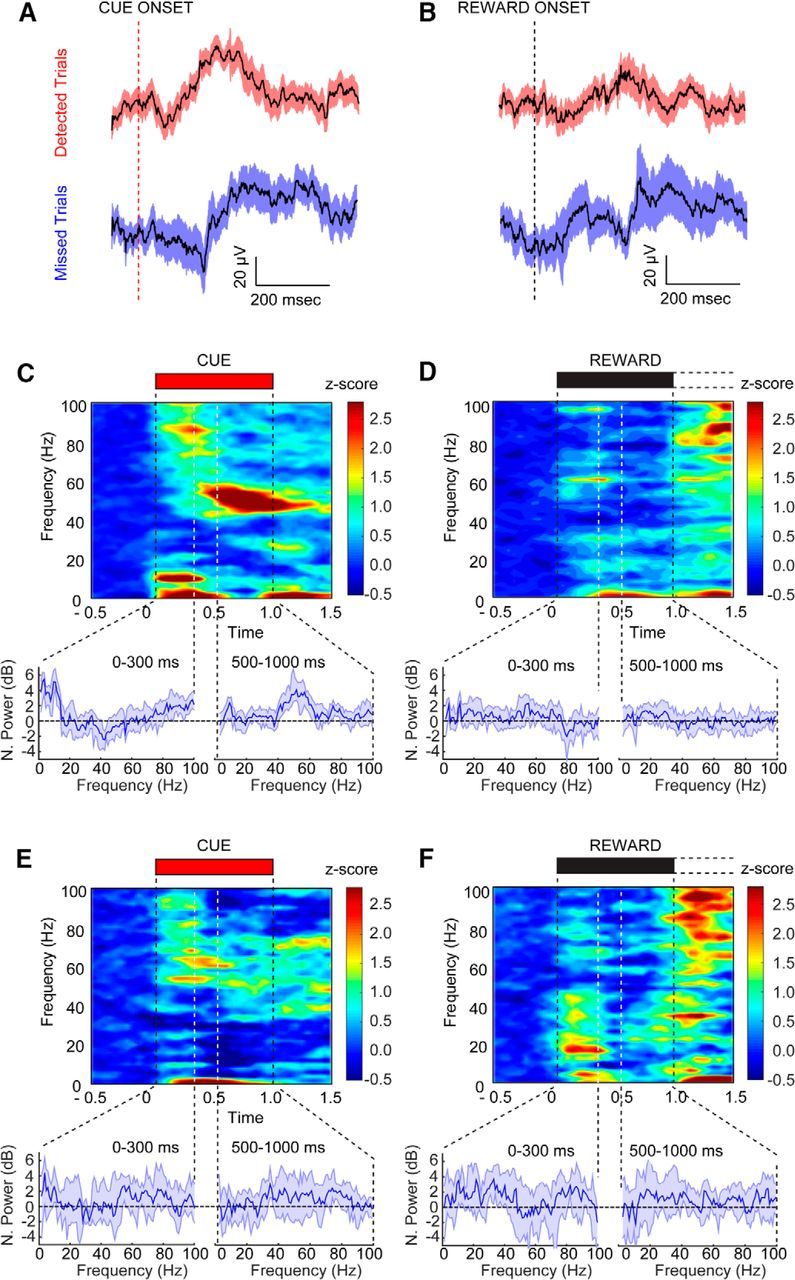
Figure 6.

Cue detection is represented by oscillations in the LFP. A, B, Cue- and reward-triggered changes in the LFP from detected (n = 7 animals, 63 trials) and missed trials (n = 24 trials) in blocks 2 and 3 for all ACSF-infused animals. Broad-spectrum LFPs did not differ substantially on detected and missed trials. C–F, Cue- and reward-triggered changes in neural oscillations from the same trials. The power spectrum from the highlighted period above is shown below each spectrogram. The left spectrum represents time points 0–300 ms after cue, and the right spectrum represents time points 500–1000 ms after cue. C, Spectrogram for the cue window when such cues were detected. Detected cues selectively evoked increases in delta, theta, and high gamma oscillations in the early phase of cue presentation, and sustained low gamma oscillations in the late phase. D, Population spectrogram from the reward-presentation period for the detected trials shown in C with the corresponding spectrum below. E, Cue-triggered population spectrogram for missed trials. Missed cues were associated with increased theta and high gamma power but lacked the low gamma power increases during the late phase of cue presentation. F, Reward-triggered population spectrogram corresponding to the same trials shown in E. Power was Z-score normalized to the 1 s before cue/reward. Error bars represent the 95% confidence intervals for the median Z-scored power.
