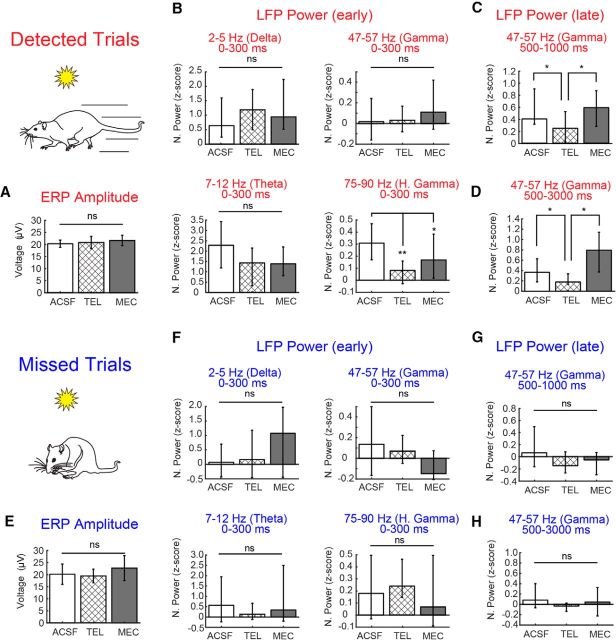
Figure 8.
Bar plots quantifying the reduction in power shown in the population spectrograms across the three frequency ranges during cue presentation on detected and missed trials. A, ERP amplitude associated with the visual cue was not influenced by local cholinergic receptor antagonism. B, During the first 300 ms of cue presentation on detected trials, power in the high gamma frequency was reduced by both the mAChR (M1) antagonist telenzepine (TEL) and the nAChR receptor antagonist mecamylamine (MEC). C, D, Normalized gamma power during the late phase of the cue window (C; 500–1000ms) and the 2 s following the cue and before reward delivery (D; 500–3000ms) was selectively reduced by telenzepine. E–H, Effects of cue presentation on ERP amplitude (E) and LFP power (F–H) on missed trials. Missed cues lacked the robust changes in high and low gamma power seen during detected cues. Neither cholinergic receptor antagonist affected the residual power observed in these frequency ranges. Error bars represent the 95% confidence intervals for the median Z-scored power. *p < 0.05; **p < 0.01.

