Figure 9.
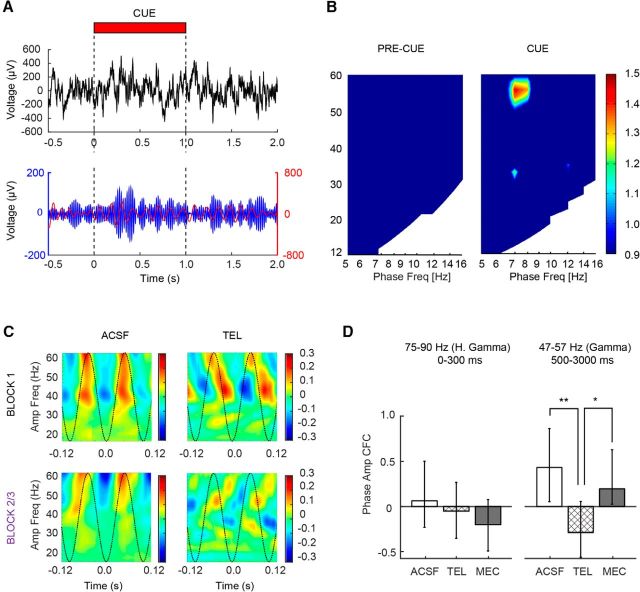
Gamma and theta exhibit phase–amplitude cross-frequency coupling following detected cues. A, Single trial example of raw LFP (top) and bandpass-filtered LFP for theta (red) and gamma (blue). Note the increase in gamma power is phase aligned at theta peaks beginning ∼500 ms into cue presentation and extends into the delay period before reward delivery. B, Population CFC comodulograms from the precue (left) and late cue/postcue periods (500–3000 ms; right) for all ACSF-infused animals during the infusion and postinfusion blocks (n = 7 animals, 63 trials). CFC coupling in the postcue window was normalized to the precue CFC shown on the left. C, Illustration of the capacity of telenzepine (TEL) to potently disrupt the CFC phase relationship between gamma and theta during cue presentation and reward retrieval. Individual phase–amplitude plots from a representative animal showing gamma power modulation as a function of theta phase from the preinfusion (block 1; top) and postinfusions (block 2/3; bottom) periods in the presence of ACSF (left) and telenzepine (right). D, Population histogram showing median precue subtracted theta–gamma CFC strength of coupling following infusion. Coupling strength for high gamma–theta in the first 300 ms is shown on the left, and low gamma–theta is shown on the right. Note gamma–theta CFC coupling was specific to the low gamma range during the late phase of cue detection. Error bars reflect bootstrapped 95% confidence intervals. *p < 0.05; **p < 0.01.

