Figure 1.

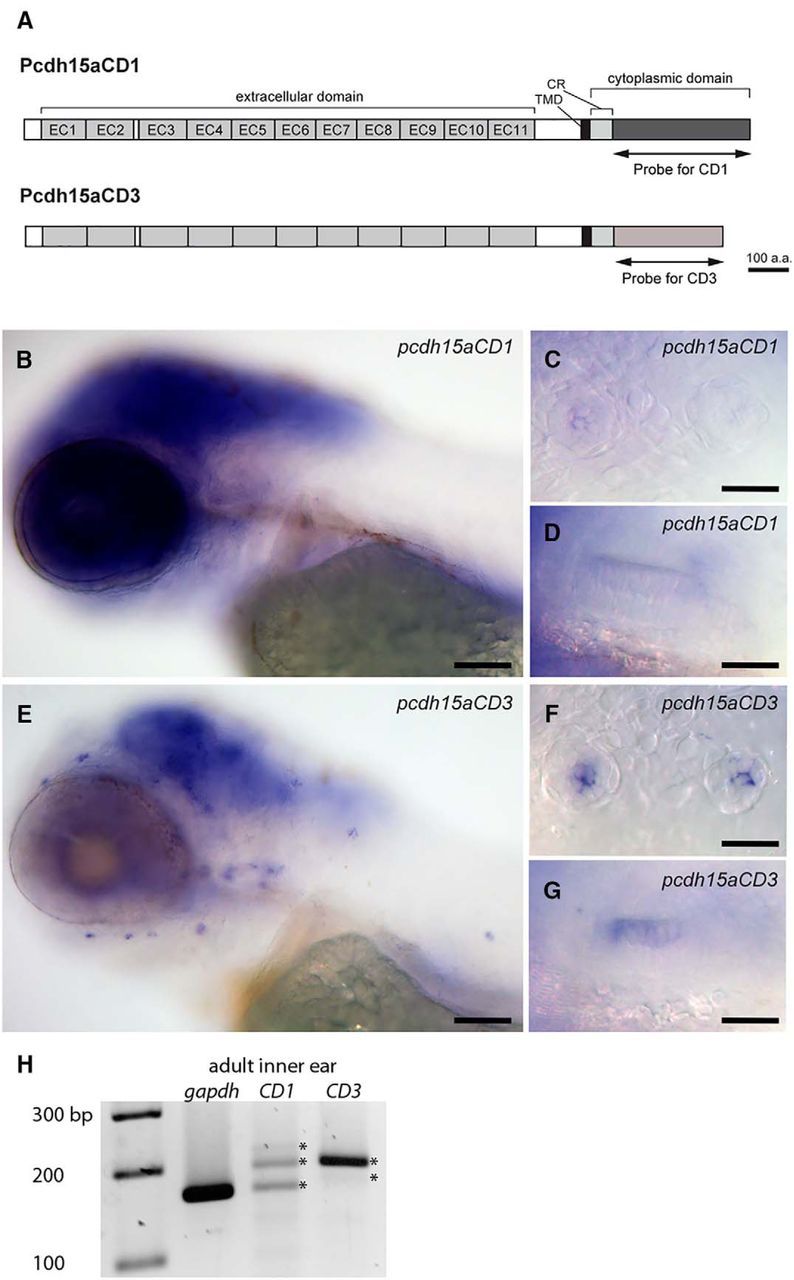
Expression pattern of the two splice variants pcdh15a-CD1 and pcdh15a-CD3 using in situ hybridization with specific probes for each transcript. A, Schematic drawing of Pcdh15a-CD1 and Pcdh15a-CD3 proteins. The positions of the probes used for in situ hybridization experiments are indicated. B–D, pcdh15a-CD1 expression at 4 dpf. E–G, pcdh15a-CD3 expression at 4 dpf. C, F, Higher-magnification views of two trunk neuromasts. D, G, Higher-magnification view of the anterior macula. Scale bars: B, E, 100 μm; C, D, F, G, 25 μm. H, Semiquantitative PCR of pcdh15a cDNA from adult inner ear tissue using isoform-specific primers (products from 35 cycles are shown). The relative density of the PCR products for CD3 splice variants (2 bands) is 2.3-fold higher than CD1 splice variants (three bands). Bands are indicated by asterisks.
